
Epsilon-Delta Continuity Definition Demo
Loading the math board and drawing, please wait…
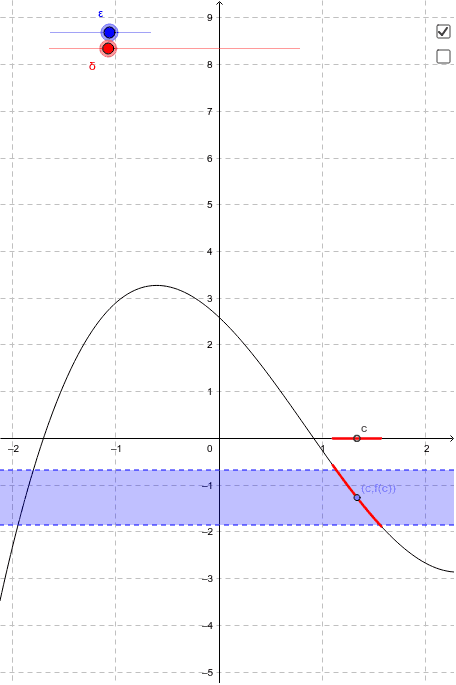
This example visually demonstrates the epsilon-delta definition of continuity using dynamic geometry, illustrating the conditions for a function to be continuous at a point. Key math concepts include continuity, epsilon-delta language, and function limits. GeoGebra commands like Point, Function, and Slider are used to construct the function graph, critical points, epsilon-delta neighborhoods, and dynamically validate the definition. Suitable for high school and above learners to understand abstract continuity concepts and calculus fundamentals.
GeoGebra Commands & Parameters
Point(f) → AFunction(f, x(A) - d, x(A) + d) → fdFunction(0, x(A) - d, x(A) + d) → xdPoint(g) → BPoint(h) → CFunction(g, x(B) - d, x(B) + d) → gdFunction(h, x(C) - d, x(C) + d) → hdFunction(0, x(B) - d, x(B) + d) → xgFunction(0, x(C) - d, x(C) + d) → xh
AI Drawing Prompt Reference
Draw a graph of a continuous function, define ε-δ neighborhoods using points A and B, draw the function f and g within their respective ε-δ neighborhoods, and also draw the ε-δ neighborhoods on the x-axis. Finally, verify the continuity condition within these neighborhoods.
The prompt above was compiled from the original drawing commands and is for reference only.