
End Behavior of Limits (Wiggles)
Loading the math board and drawing, please wait…
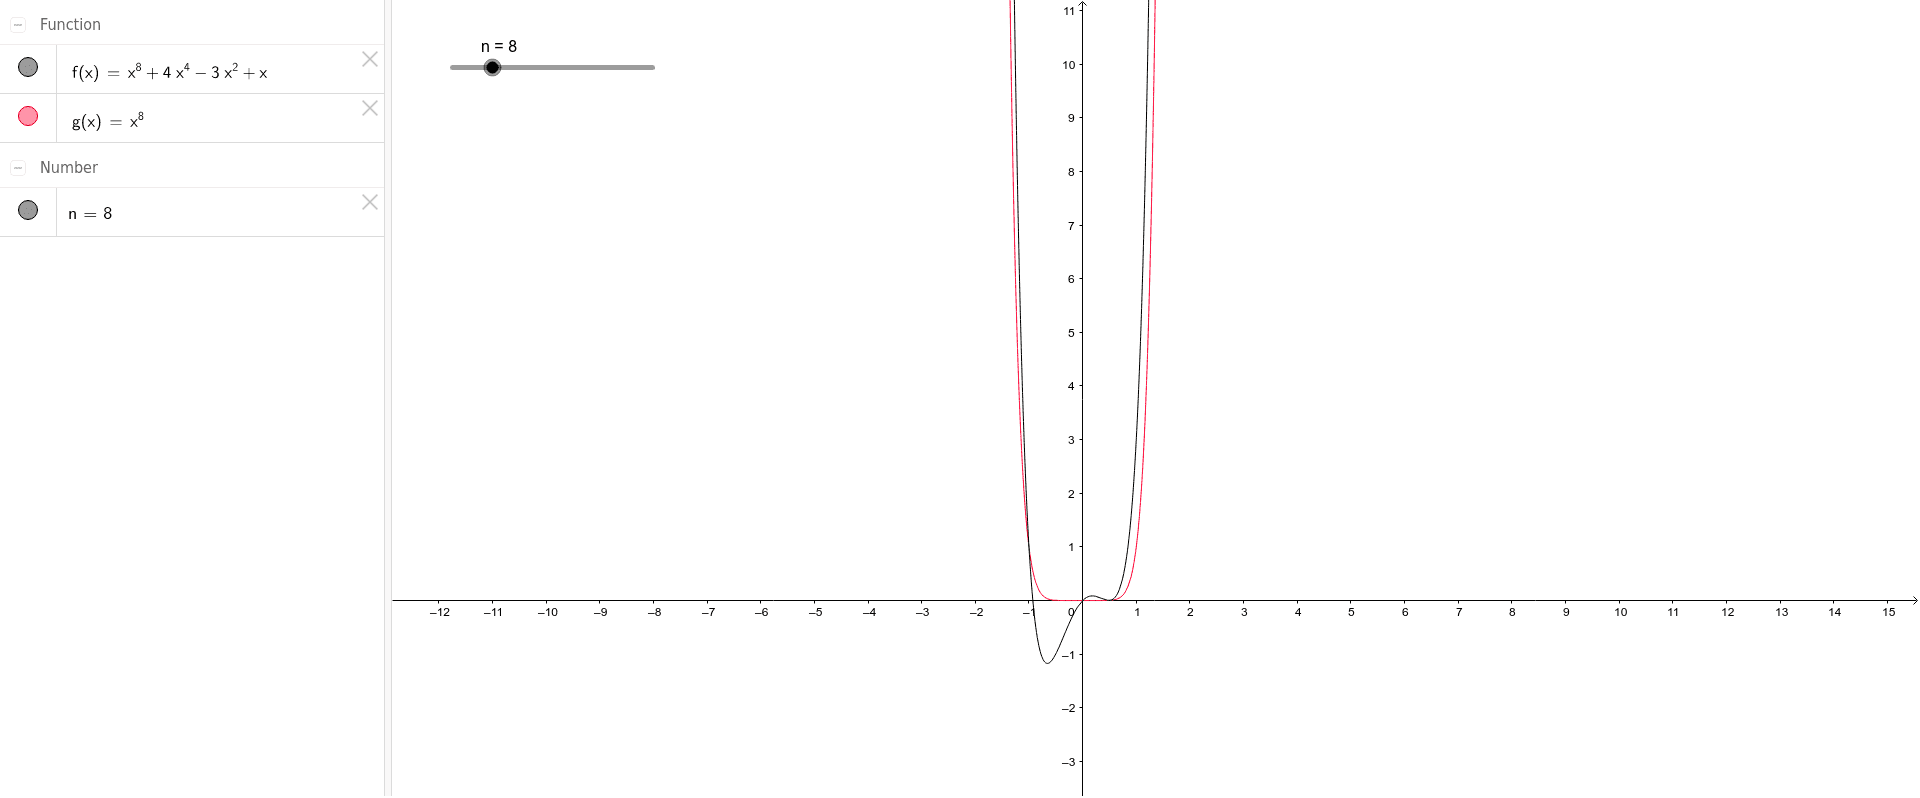
This example demonstrates the end behavior of functions, particularly wiggling phenomena as limits are approached. Core math concepts include limits, median line, area, cuboid, geometric transformations, and unit circle. It is constructed using GeoGebra objects n, g, f, making it suitable for high school and above students studying calculus to understand dynamic changes in function limits.
GeoGebra Commands & Parameters
Numeric n(8)g(x) = x^(n)f(x) = x^(n) + (4 * x^(4)) - (3 * x^(2)) + x
AI Drawing Prompt Reference
Draw a graph of a function to show its behavior as x approaches infinity. The graph should include a curve that fluctuates near the limit, and a reference line to indicate the average trend. Ensure the graph is clear to illustrate the dynamic changes in the function's limit behavior.
The prompt above was compiled from the original drawing commands and is for reference only.