
Effects of Parameters on Sine Functions
Loading the math board and drawing, please wait…
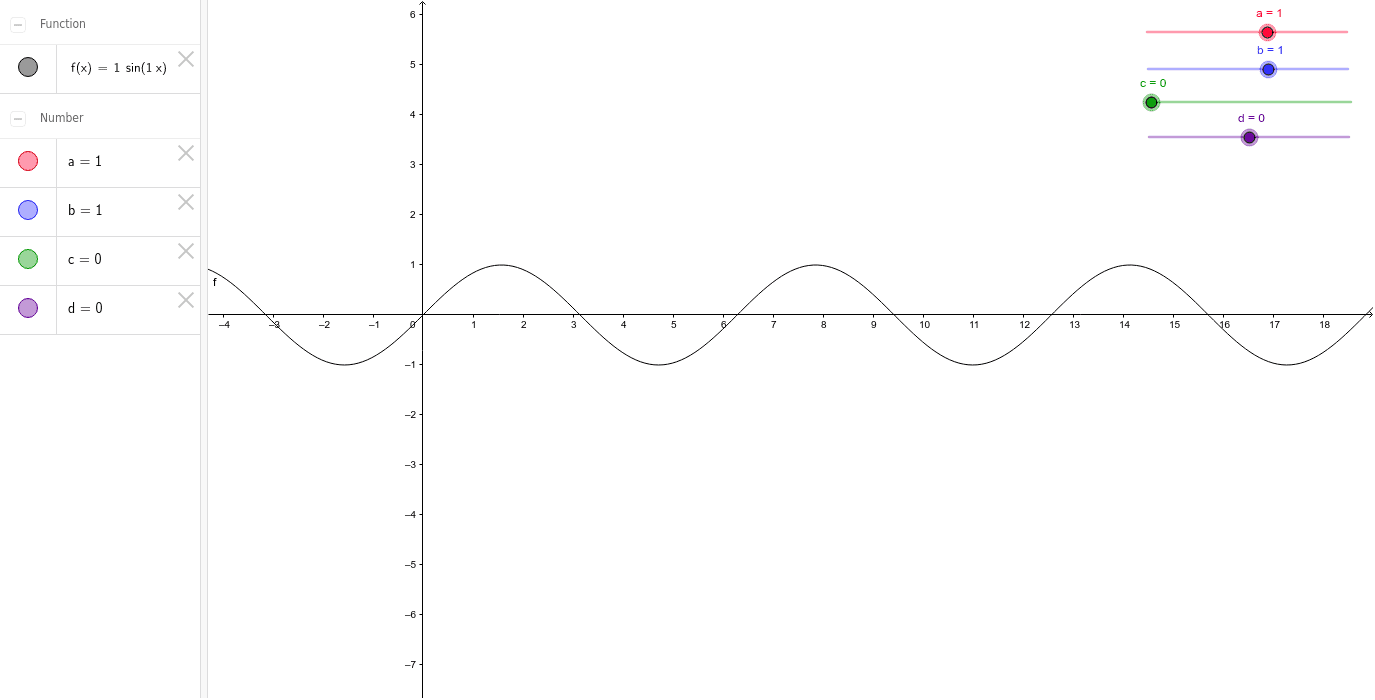
This example demonstrates how the sine function graph changes with parameters a (amplitude), b (period), c (phase shift), d (vertical shift), and f (frequency). It covers core math concepts like sine function properties, parametric equations, and function graph transformations. GeoGebra commands/objects a, b, c, d, f are used to create sliders, allowing dynamic adjustment of parameters to observe graph changes. Suitable for high school mathematics teaching, calculus, and analytical geometry入门.
GeoGebra Commands & Parameters
Numeric a(1.0)Numeric b(1.0)Numeric c(0.0)Numeric d(0.0)f(x) = (a * sin((b * x) + c)) + d
AI Drawing Prompt Reference
Draw a sine function graph with five adjustable parameters: amplitude, period, phase shift, vertical shift, and frequency. Observe how the sine function graph changes as these parameters are adjusted to demonstrate properties of the sine function, parametric equations, and transformations of function graphs.
The prompt above was compiled from the original drawing commands and is for reference only.