
Dynamic Visualization of Liquid Pouring into an Inverted Cone
Loading the math board and drawing, please wait…
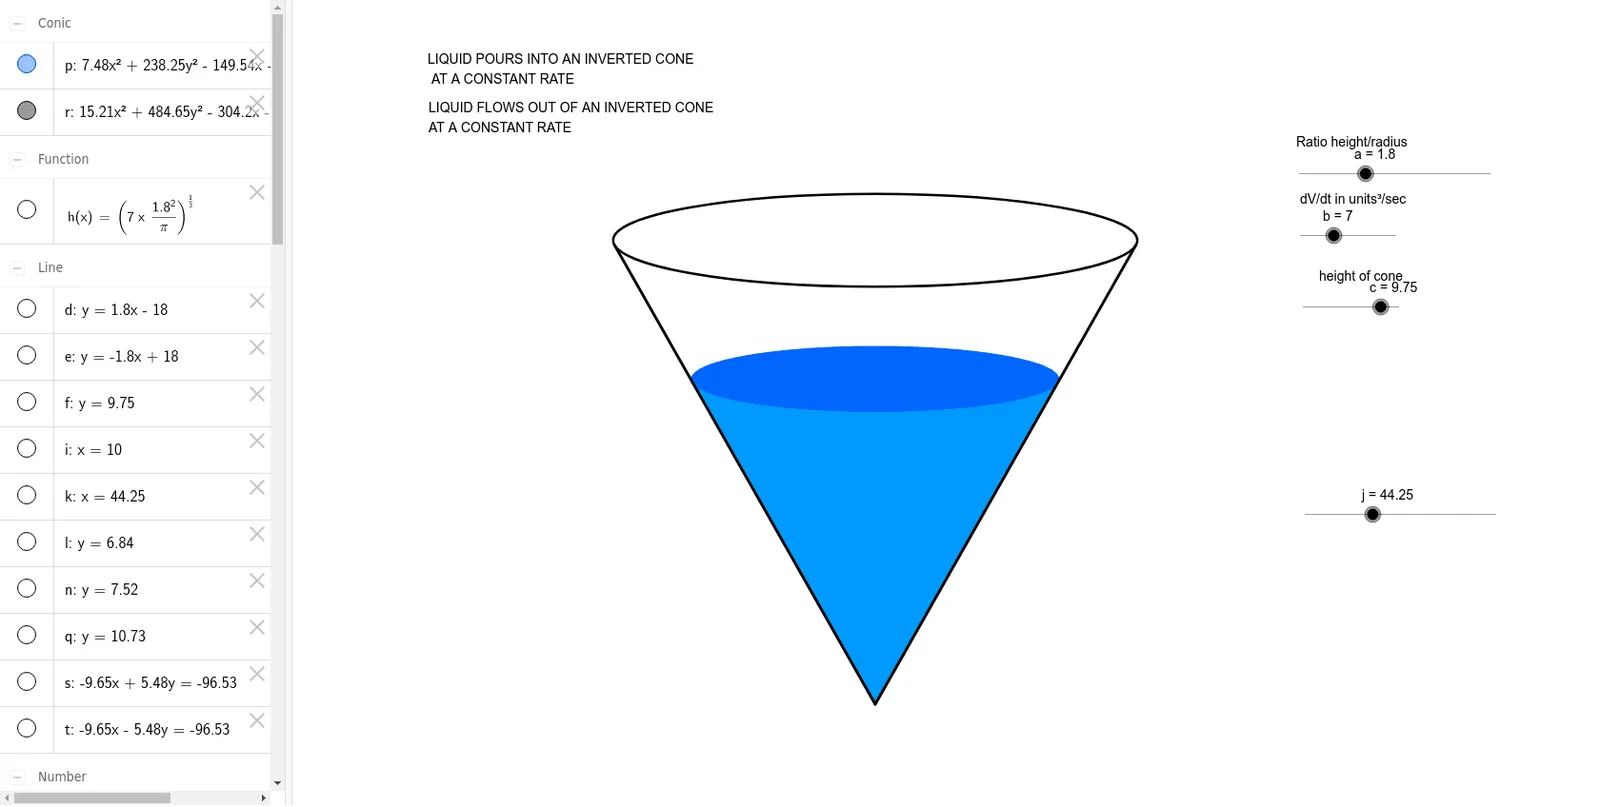
This interactive example provides a visual representation of the classic calculus problem involving liquid flowing into or out of an inverted cone. It focuses on the concept of Related Rates, demonstrating how the volume, height, and radius of the liquid change relative to time. The construction employs GeoGebra commands such as Polygon for the cone's cross-section, Segment and Intersect to determine the liquid level, and Ellipse to represent the circular surface of the fluid. By manipulating parameters and objects (e.g., a, b, c), users can observe the dynamic relationship between flow rate and height. It is an ideal tool for AP Calculus or undergraduate mathematics students studying derivatives and solid geometry.
GeoGebra Commands & Parameters
Intersect(h, f, (128.38688727560972, 9.75)) → BIntersect(h, k, (44.25, 6.836001523753812)) → AOrthogonalLine(A, k) → lIntersect(e, d) → COrthogonalLine(C, xAxis) → iIntersect(i, n) → DIntersect(e, l) → EIntersect(d, l) → FEllipse(E, F, D) → pIntersect(i, q) → GIntersect(f, e) → HIntersect(d, f) → IEllipse(H, I, G) → rTangent(C, r) → s, tIntersect(r, t) → LIntersect(r, s) → MIntersect(p, t) → N, PIntersect(p, s) → O, QPolygon(C, O, N) → poly1, n_1, c_1, oSegment(C, M) → a_1Segment(C, L) → b_1