
Dynamic Scatter Diagrams
Loading the math board and drawing, please wait…
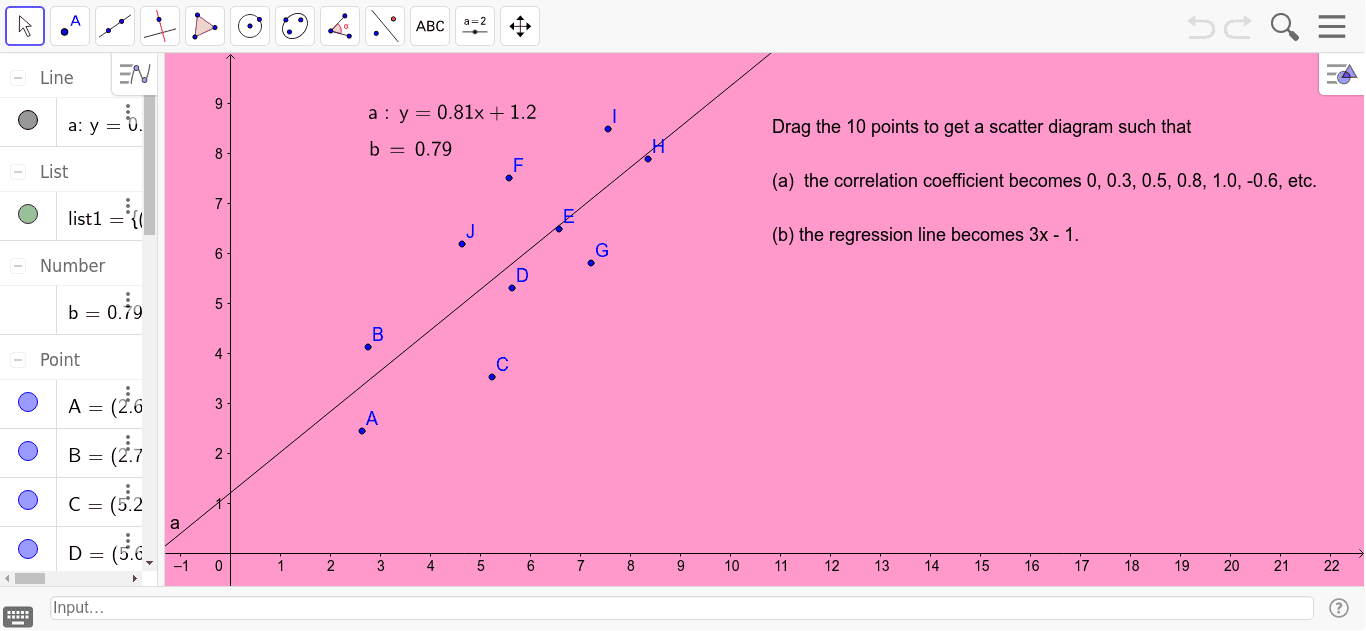
This dynamic worksheet explores the relationship between the scattering of points and the correlation coefficient (and the regression line). Key mathematical concepts include the correlation coefficient and the regression line. Using GeoGebra commands such as FitLineY, LaTeX, and PMCC, you can dynamically adjust the positions of the points to observe their impact on the correlation coefficient and the regression line. Suitable for high school and above students or teachers.
GeoGebra Commands & Parameters
FitLineY(list1) → aLaTeX(a, true, true) → text1PMCC(list1) → bLaTeX(b, true, true) → text2
AI Drawing Prompt Reference
Create a dynamic scatter plot with points, regression line, and correlation coefficient. First, randomly generate some points, then use the FitLineY command to calculate the regression line and display its LaTeX expression. Next, compute the correlation coefficient and display its LaTeX expression. Move the points to observe their impact on the regression line and correlation coefficient.
The prompt above was compiled from the original drawing commands and is for reference only.