
Dynamic Demonstration of Pascal's Theorem
Loading the math board and drawing, please wait…
In collections
Conic Section Collection
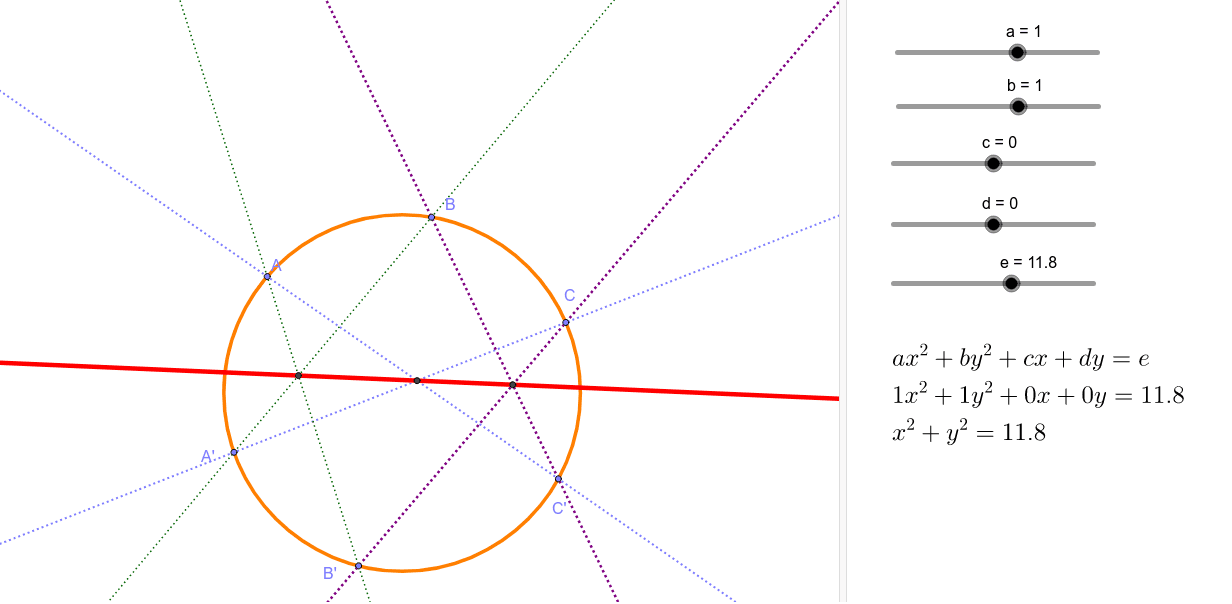
This example provides an interactive visualization of Pascal's Theorem (also known as the Hexagrammum Mysticum Theorem), which states that if six arbitrary points are chosen on a conic section, the intersection points of opposite sides of the resulting hexagon are collinear. The construction utilizes GeoGebra's Point, Line, and Intersect commands to define the vertices (A, B, C, A', B', C') and their corresponding opposite side intersections (G, H, I), culminating in the Pascal line k. This tool is ideal for high school advanced geometry, undergraduate projective geometry courses, and educational demonstrations of conic section properties.
GeoGebra Commands & Parameters
Point(q) → APoint(q) → BPoint(q) → CPoint(q) → C'Point(q) → B'Point(q) → A'Line(A, C') → wLine(C, A') → vLine(A, B') → rLine(A', B) → hLine(B, C') → iLine(C, B') → jIntersect(r, h) → GIntersect(w, v) → HIntersect(i, j) → ILine(G, H) → k
AI Drawing Prompt Reference
Draw a dynamic visualization of Pascal's Theorem with six points on a conic, connect opposite vertices to form a hexagon, mark the intersections of opposite sides, and show the collinear line through these intersection points to demonstrate the theorem.
The prompt above was compiled from the original drawing commands and is for reference only.