
Draw a Parabola with the Locus
Loading the math board and drawing, please wait…
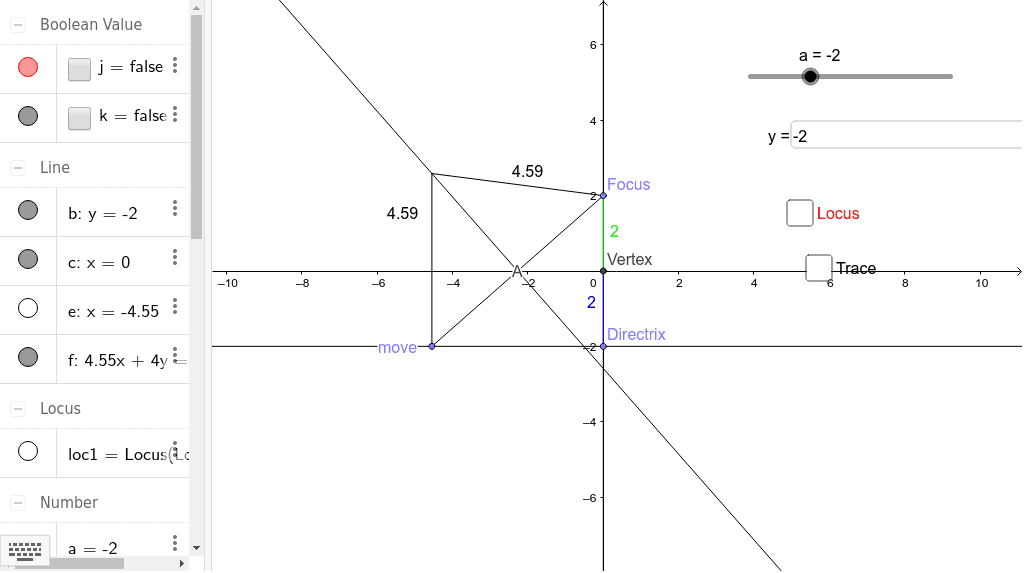
This example demonstrates how to draw a parabola using the locus method. Key mathematical concepts include the definition and properties of a parabola. GeoGebra commands used include text field, point, orthogonal line, midpoint, segment, intersect, distance, locus, etc. Suitable for high school mathematics education and learning.
GeoGebra Commands & Parameters
Textfield(a) → inputBox1Point(b) → DirectrixOrthogonalLine(Directrix, b) → cPoint(c) → FocusMidpoint(Focus, Directrix) → VertexPoint(b) → moveSegment(Focus, move) → dOrthogonalLine(move, b) → eMidpoint(move, Focus) → AOrthogonalLine(A, d) → fIntersect(e, f) → LocusSegment(Locus, Focus) → gDistance(e, g) → hSegment(Locus, move) → iLocus(Locus, move) → loc1Segment(Focus, Vertex) → lSegment(Vertex, Directrix) → m
AI Drawing Prompt Reference
Draw a parabola where the distance from any point on the parabola to the directrix is equal to its distance to the focus. Start by drawing the directrix and the focus, then find the midpoint between the focus and the directrix as the vertex. Move the focus and draw a segment from the focus to the new point, as well as a perpendicular line from the new point to the directrix. The intersection of these two lines gives a new point, and the locus of these points forms the parabola. Finally, connect the focus to the vertex and the vertex to the directrix.
The prompt above was compiled from the original drawing commands and is for reference only.