
Dot Plot Tool
Loading the math board and drawing, please wait…
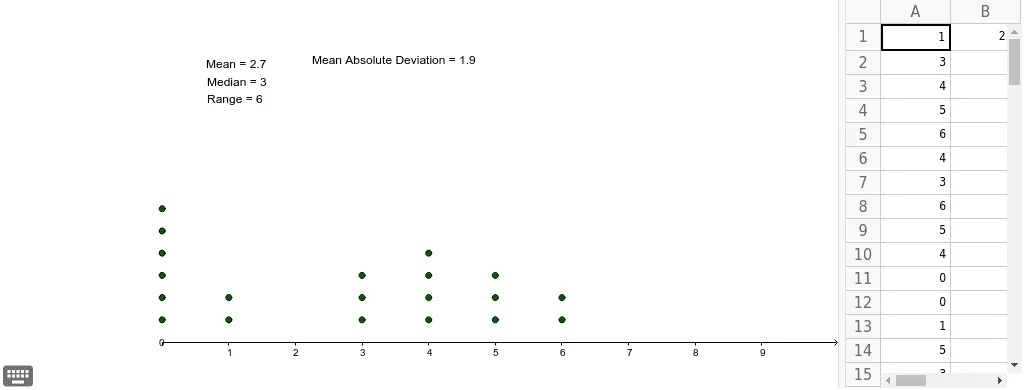
This is a dot plot tool that allows up to 30 values to be used. It demonstrates data distribution and involves core statistical concepts such as mean and median. Using GeoGebra commands like DotPlot, Mean, and Median, it visually represents the central tendency of data. Suitable for middle school and above students to learn data statistics and analysis.
GeoGebra Commands & Parameters
DotPlot(A1:A20) → list1Mean(A1:A20) → B1Median(A1:A20) → aMedian(A1:A20) → bMedian(A1:A20) → cMedian(A1:A20) → C1Mean(F1:F20) → G1
AI Drawing Prompt Reference
Create a data distribution plot showing up to 30 data points, highlighting the mean and median with different colored lines. First, plot the scatter of data points, then add vertical lines to indicate the positions of the mean and median. Ensure there are three lines for the median and one for the mean to clearly show the central tendency of the data.
The prompt above was compiled from the original drawing commands and is for reference only.