
Dot Plot Tool by Ms. Lyons
Loading the math board and drawing, please wait…
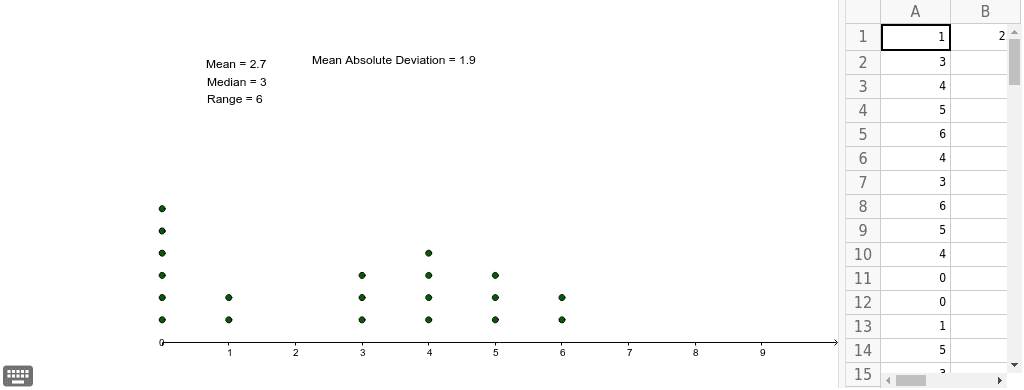
This example demonstrates how to use the dot plot tool to create a scatter plot with up to 30 values. It involves core mathematical concepts such as statistics, mean, and median. The construction uses GeoGebra commands and objects like DotPlot, Mean, Median, and elements like lists A1-E10, variables B1, a-c. It is suitable for high school mathematics teaching, particularly in probability and statistics.
GeoGebra Commands & Parameters
DotPlot(A1:A20) → list1Mean(A1:A20) → B1Median(A1:A20) → aMedian(A1:A20) → bMedian(A1:A20) → cMedian(A1:A20) → C1Mean(F1:F20) → G1
AI Drawing Prompt Reference
Create a scatter plot with up to 30 values, showing statistical mean and median. Include a line for the mean and three lines for different medians, all derived from the same dataset, with clear labels for each line.
The prompt above was compiled from the original drawing commands and is for reference only.