
Distances in St. Louis Geometry Demo
Loading the math board and drawing, please wait…
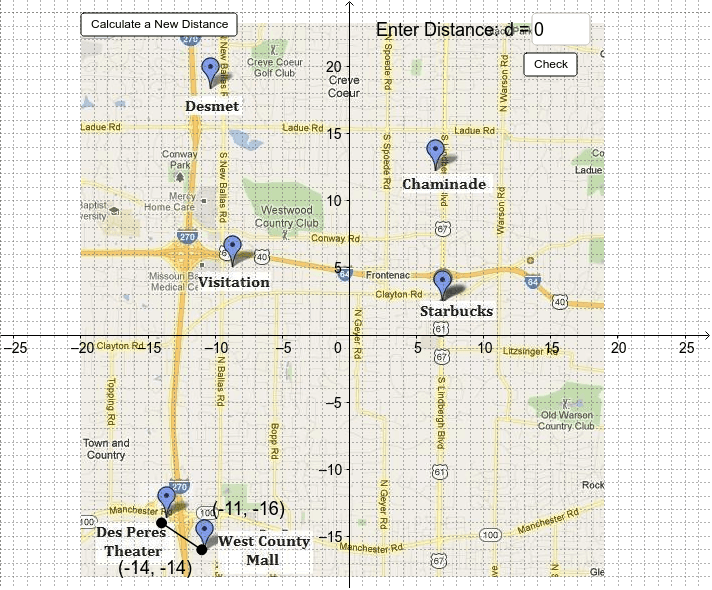
① This example demonstrates calculating distances between two points on a St. Louis map using coordinate geometry and plotting the resulting hyperbola locus. ② Core mathematical concepts include coordinate systems, segment length, the Pythagorean theorem, the law of cosines, and the definition of conic sections (hyperbola). ③ Construction highlights: Segment creates line segments, Point defines key points, Textfield and InputBox enable interactive input, Buttons control dynamic updates, and objects such as c and a build the hyperbola equation. ④ Suitable for high‑school analytic geometry and trigonometry lessons, as well as university‑level geometric modeling demonstrations.
GeoGebra Commands & Parameters
Segment(G, H) → cTextfield(Guess) → inputBox1Point(yAxis) → IPoint(yAxis) → J
AI Drawing Prompt Reference
Draw a coordinate plane over a St. Louis map. Place two fixed points and connect them with a line segment. Add two movable points on the vertical axis. Include a text input box for a guessed value and a button to trigger updates. Using the distance between the two fixed points and the law of cosines, construct a hyperbola locus showing points where the difference of distances to the two fixed points is constant. The figure should show axes, map, segment, input box, and button, illustrating distance and conic sections.
The prompt above was compiled from the original drawing commands and is for reference only.