
Distance, Speed and Time Animation
Loading the math board and drawing, please wait…
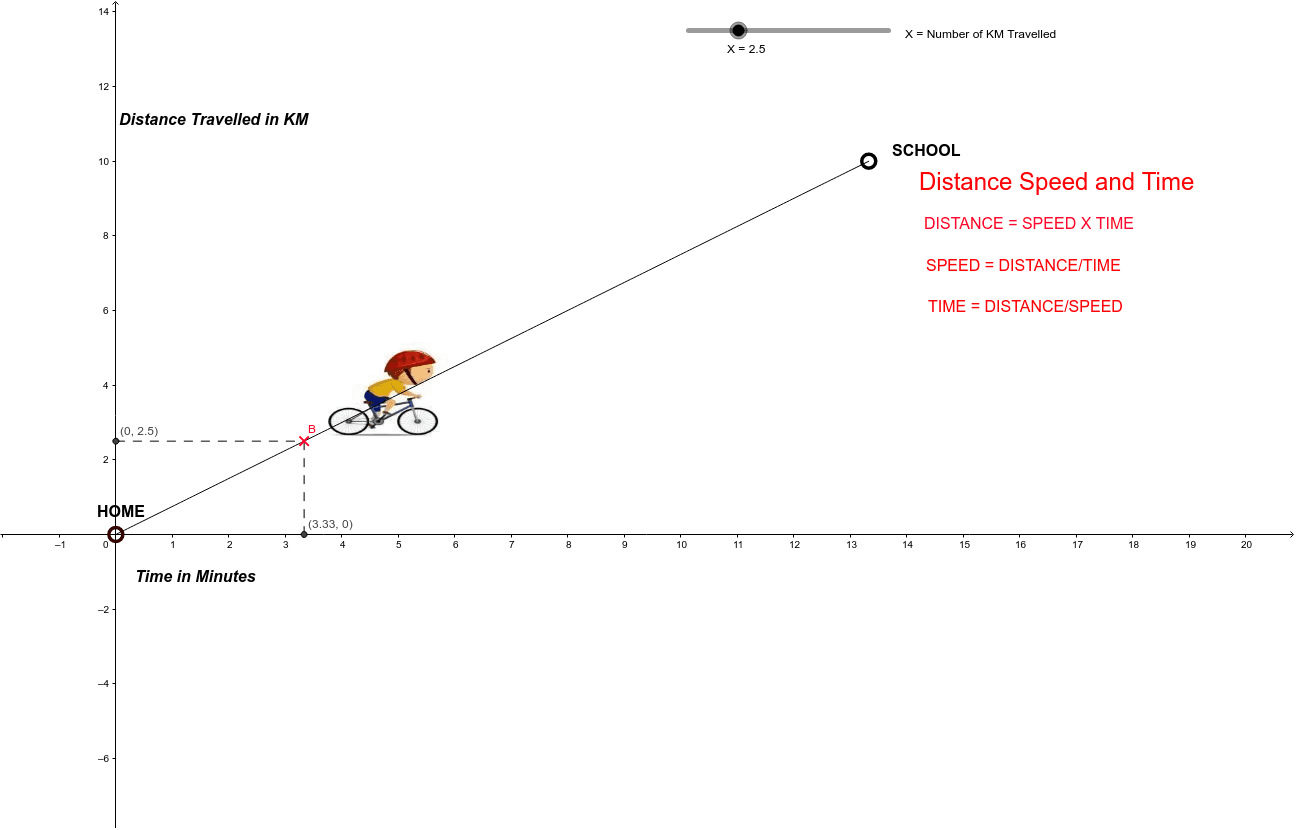
This example demonstrates the relationship between distance, speed, and time through animation. It involves core math concepts like arithmetic, ratios, 2D vectors, algebra, squares, and statistics. Construction highlights include GeoGebra commands and objects such as Function, LaTeX, Intersect, and Segment. Suitable for middle school students learning basic kinematics principles.
GeoGebra Commands & Parameters
Function(((-((-0.75))) * x), 0, 13.33) → fLaTeX(f, true, true) → text1Intersect(A, f) → BSegment(C, B) → aSegment(B, D) → b
AI Drawing Prompt Reference
Draw a function graph and display its expression, then mark a point on the graph. Draw a horizontal segment from the point to the graph and a vertical segment from the point to the x-axis. Finally, connect the horizontal and vertical segments to form a new segment, illustrating the relationship between distance, speed, and time.
The prompt above was compiled from the original drawing commands and is for reference only.