
Discovery Quadratics Example
Loading the math board and drawing, please wait…
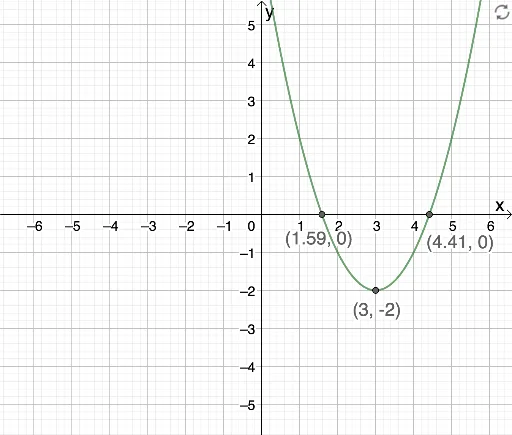
This example demonstrates the dynamic relationship between quadratic function graphs, their roots, and extremum points through GeoGebra. It involves core math concepts like quadratic functions, function graphs, roots, extremum points, and the impact of coefficients. Constructed using GeoGebra commands Root and Extremum, with objects f (function) and parameters A, B, C. Ideal for high school mathematics teaching to visually aid students in understanding the properties of quadratic functions and the effect of parameters on the graph.
GeoGebra Commands & Parameters
Root(f) → A, BExtremum(f) → C
AI Drawing Prompt Reference
Draw the graph of a quadratic function and display its two roots and vertex to visually demonstrate the relationship between the graph of a quadratic function, its roots, and its vertex, as well as the impact of parameters on the function's graph. First, plot the graph of the quadratic function, then find and mark the points where the graph intersects the x-axis as the roots, and finally find and mark the vertex of the graph.
The prompt above was compiled from the original drawing commands and is for reference only.