
Discovering the Regression Line
Loading the math board and drawing, please wait…
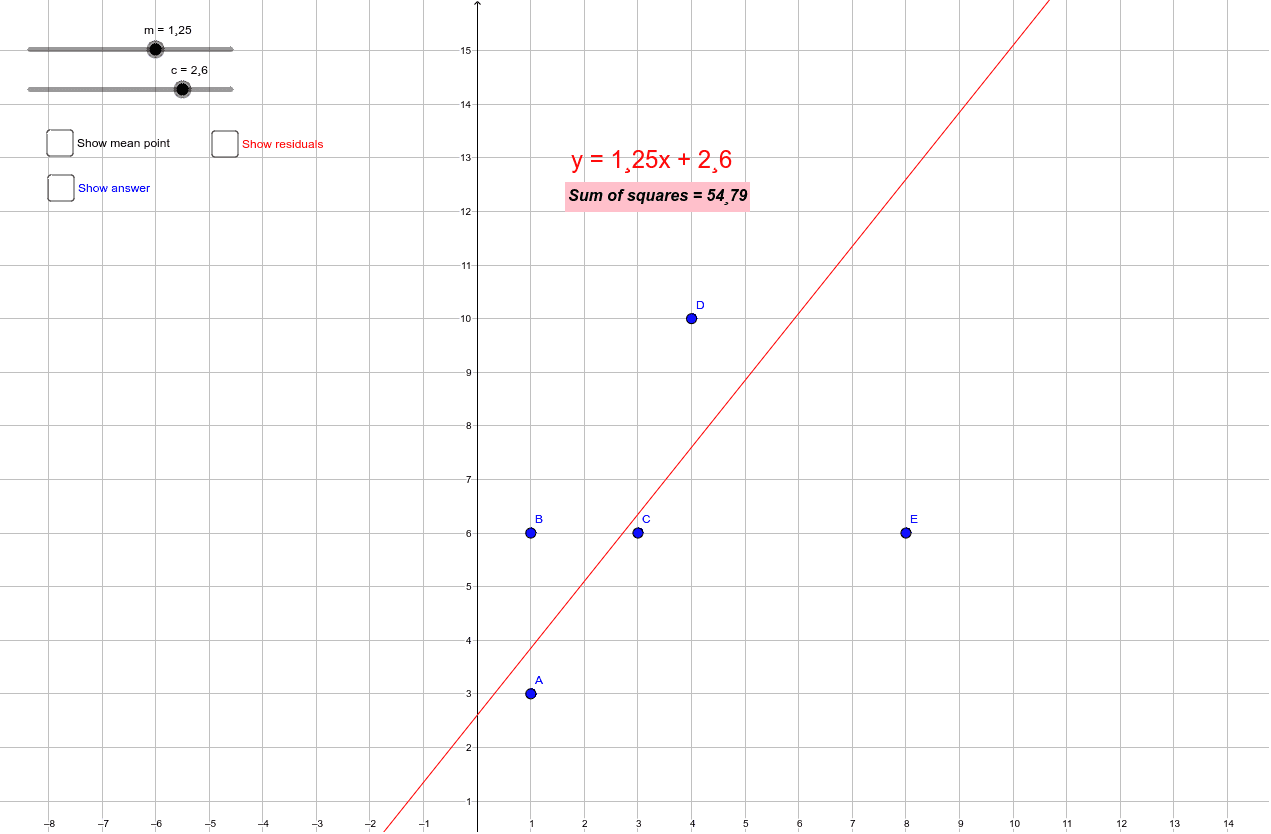
This example demonstrates how to find the regression line for a set of data points by minimizing the sum of squared errors. Key mathematical concepts involved include correlation, statistics, expected value, Riemann sums, solids or 3D shapes, parallelograms, and kites. The construction uses GeoGebra commands such as Segment, SumSquaredErrors, and FitLineY. It is suitable for high school and above, providing an intuitive understanding of regression analysis and its computational methods.
GeoGebra Commands & Parameters
Segment(A, A') → gSegment(B, B') → hSegment(C, C') → iSegment(D, D') → jSegment(E, E') → kSumSquaredErrors(list, f) → aFitLineY(list) → lSumSquaredErrors(list, l) → eSegment(A, Aans) → pSegment(B, Bans) → qSegment(C, Cans) → rSegment(D, Dans) → sSegment(Eans, E) → t