
Discovering Function Equations: From Graphs to Algebraic Forms
Loading the math board and drawing, please wait…
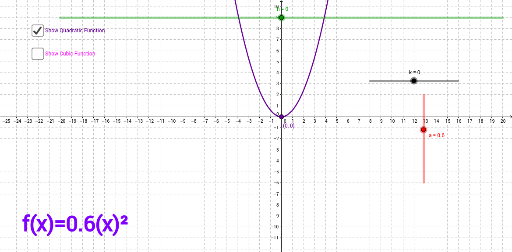
① This GeoGebra example demonstrates how to derive function equations from geometric figures such as parallelograms, rhombi, polygons, sine curves, and tangent lines, revealing the correspondence between visual shapes and algebraic expressions. ② Core mathematical concepts include function definitions, solving equations, sine function graphs, tangent slopes, coordinates of polygon vertices, and using turning points to identify extrema. ③ Construction highlights: Based on the summary, the TurningPoint command is used to mark critical turning points, with point objects (A, P, J, etc.) and function objects (f, g) created; text objects (text1–text4) display equations or explanations. Objects include k, a, h, k_1, c, b, d, p, C, j, J, P, and F, forming an interactive environment for exploring graphs and equations. ④ Suitable for upper secondary to pre-university students, this example supports teaching on functions and coordinate geometry, and serves as a resource for inquiry-based lessons where learners connect graphical features with algebraic representations.
GeoGebra Commands & Parameters
TurningPoint(g) → APoint(p) → C
AI Drawing Prompt Reference
Draw a coordinate system containing a function graph and geometric shapes. Start with a sine curve and mark a critical turning point on it, indicating an extremum. Then add a polygon (such as a parallelogram or rhombus) whose vertices relate to the function's equation. Include a tangent line touching the curve at a point, showing its slope. Label the function equation, vertex coordinates, and turning point with text to clearly illustrate the correspondence between visual shapes and algebraic expressions. Arrange elements neatly for easy comparison.
The prompt above was compiled from the original drawing commands and is for reference only.