
Dice Roll Probability Demo by Zoltán Fehér
Loading the math board and drawing, please wait…
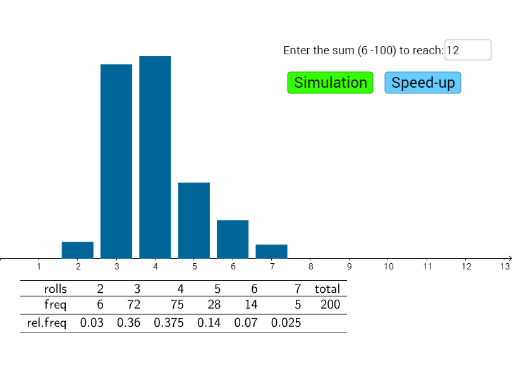
This example dynamically simulates dice rolls to visually demonstrate frequency distribution in probability statistics. Core math concepts include probability, frequency distribution, random events, and bar charts. Construction highlights GeoGebra commands like Unique, Frequency, Max, Random, Sum, BarChart, Textfield, Append, and TableText. Suitable for high school probability statistics teaching as an auxiliary demonstration tool.
GeoGebra Commands & Parameters
Unique(maxlist) → list1Frequency(maxlist) → freqMax(freq) → bRandom(1, 6) → ddSum(list) → sumBarChart(maxlist, 0.8) → aTextfield(maxsum) → inputBox1Append("freq", freq) → row2Append("rolls", list1) → row1Append(row1, "total") → list2Append(row2, ism) → list3Append("rel.freq", list4) → row3TableText({list2, list3, row3}, "r_") → table
AI Drawing Prompt Reference
This is a dynamic simulation of dice roll probability distribution. The graph shows the frequency distribution of dice points from 1 to 6, represented by bar charts. The height of each bar represents the frequency of each roll, with text boxes showing total rolls and frequency ratios. The overall design is simple and suitable for probability statistics teaching demonstrations.
The prompt above was compiled from the original drawing commands and is for reference only.