
Determine Equivalent Fractions
Loading the math board and drawing, please wait…
In collections
Equivalent Fractions
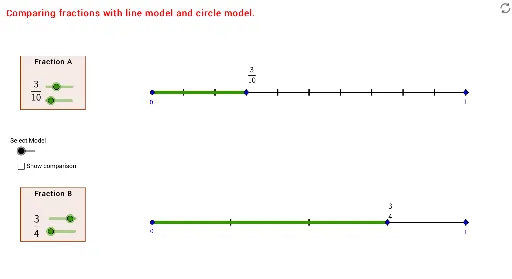
This example demonstrates how to visually determine if fractions are equivalent using geometric models. Core math concepts include the fundamental properties of fractions, area models with rectangles, and set theory. Construction highlights the use of GeoGebra commands like Segment, Sequence, Circle, Point, Rotate, CircleSector, Polygon, and objects such as denominators, numerators, and comparison lines to represent and compare fractions. Suitable for middle school and above, emphasizing the connection between geometry and fraction equivalence.
GeoGebra Commands & Parameters
Segment(A, A + (unitsize1, 0)) → line1Segment(B, B + (unitsize2, 0)) → line2Sequence((x(A) + (i * unitsize1 / denominator1), y(A)), i, 1, denominator1) → numdots1Sequence((x(B) + (i * unitsize2 / denominator2), y(B)), i, 1, denominator2) → numdots2Segment(E, (x(E), y(E) - (y(A) - y(B)))) → showcomparison_1Segment(A, E) → showfrac1_1Segment(B, F) → showfrac2_1Circle(G, unitradius) → cPoint(c) → HSegment(G, H) → aRotate(G, (360 * ° / denominator1), G) → G'Sequence(Segment[Rotate[G, ((i * 360) * ° / denominator1), G], Rotate[H, ((i * 360) * ° / denominator1), G]], i, 1, denominator1) → denominatorwedges1Circle(I, unitradius) → dPoint(d) → JSegment(I, J) → bSequence(Segment[Rotate[I, ((i * 360) * ° / denominator2), I], Rotate[J, ((i * 360) * ° / denominator2), I]], i, 1, denominator2) → denominatorwedges2Rotate(H, ((numerator1 * 360) * ° / denominator1), G) → H'Rotate(J, ((numerator2 * 360) * ° / denominator2), I) → J'CircleSector(G, H, H') → numeratorwedge1CircleSector(I, J, J') → numeratorwedge2Polygon(K, (x(K), y(K) - boxheight), (x(K) + boxwidth, y(K) - boxheight), (x(K) + boxwidth, y(K))) → poly1, e, f, g, hPolygon(L, (x(L), y(L) - boxheight), (x(L) + boxwidth, y(L) - boxheight), (x(L) + boxwidth, y(L))) → poly2, l, i, j, k
AI Drawing Prompt Reference
Draw two horizontal lines, divide the first line into equal segments based on a unit length and mark points for the denominator1, and the second line into equal segments based on a unit length and mark points for the denominator2. Use colored sectors to represent fractions, with the number of sectors corresponding to the numerator1 on the first line and numerator2 on the second line. Extend both lines vertically downwards to meet at a point, then connect this point to the endpoints of both lines to form two rectangles, where the areas represent the fractions.
The prompt above was compiled from the original drawing commands and is for reference only.