
Derivative Grapher: Visualizing Functions and Their Derivatives
Loading the math board and drawing, please wait…
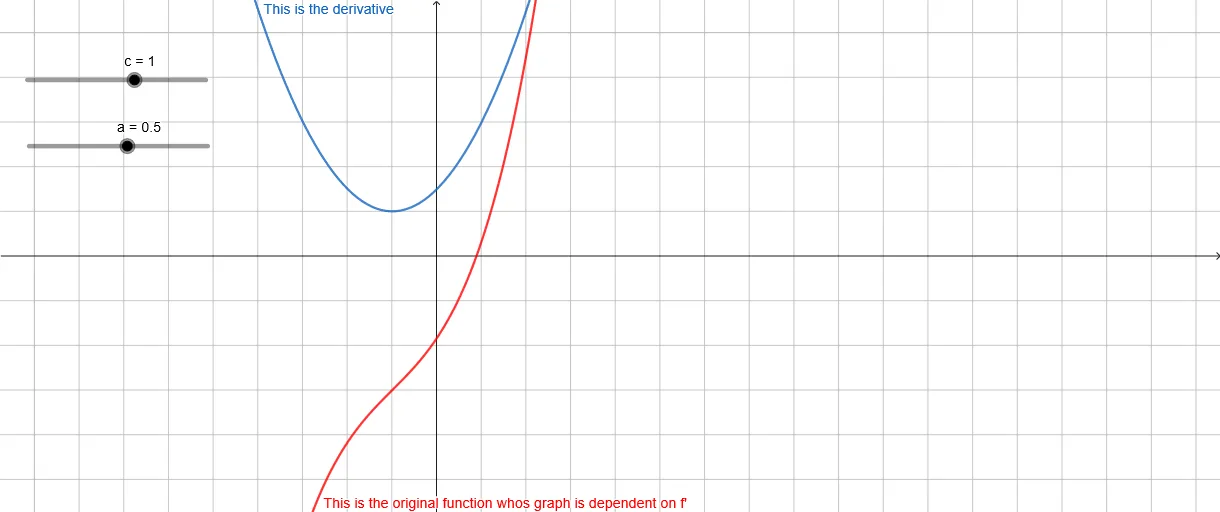
This GeoGebra example demonstrates how to plot a function and its derivative simultaneously, showing the geometric relationship between them. Key mathematical concepts include the geometric meaning of derivatives, the relationship between function monotonicity and derivative sign, the Fundamental Theorem of Calculus, as well as trigonometric functions and reflection transformations. Construction highlights: using the Derivative command to generate f'(x) from f(x), displaying the integral function F(x) to illustrate calculus relationships, and interactive buttons to switch between different functions. Suitable for high school calculus units on derivatives or introductory college mathematics, also ideal for teachers demonstrating derivative concepts visually.
GeoGebra Commands & Parameters
Numeric c(1)Numeric a_{1}(1)Numeric a(0.5)f'(x) = (a * (x + 1)^(2)) + cF(x) = (a / 3 * (x + 1)^(3)) + (c * x) - 2
AI Drawing Prompt Reference
Draw the function f(x) = a(x + 1)^2 + c and its derivative f'(x), and also plot the integral function F(x) = a/3(x + 1)^3 + cx - 2. First set the parameters a and c, then use the derivative command to generate f'(x), and finally draw f(x) and f'(x), and F(x) to illustrate the calculus relationships.
The prompt above was compiled from the original drawing commands and is for reference only.