
Definition of the Derivative – Tangent Slope and Limit Visualization
Loading the math board and drawing, please wait…
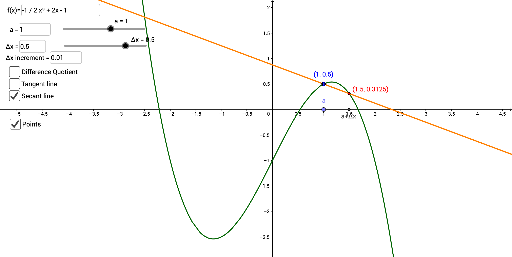
① This interactive GeoGebra example demonstrates the definition of the derivative by showing how the slope of a secant line approaches the slope of the tangent line as Δx tends to zero. ② The core mathematical concepts include the limit definition of the derivative, secant and tangent lines, and instantaneous rate of change. ③ Construction details: uses Line, Slope, Tangent commands, along with Textfield and InputBox for interactive input; a slider Δx controls the secant line's approach to the tangent; objects include function f, points A, B, C, slope value m, and related variables. ④ Suitable for high school and introductory college calculus students, this example helps visualize the transition from average to instantaneous rate of change and reinforces the concept of limits in differentiation.
GeoGebra Commands & Parameters
Line(B, C) → gSlope(g) → mTextfield(f) → InputBox1Textfield(Δx) → InputBox2Tangent(B, f) → hTextfield(a) → InputBox3Textfield(inc) → InputBox4
AI Drawing Prompt Reference
Draw a function graph and show its tangent and secant lines. By sliding the Δx value, observe how the slope of the secant line approaches the slope of the tangent line, visually demonstrating the definition of the derivative and the concept of limits. Include the function curve, a secant line formed by two movable points, a tangent line at one of the points, and dynamically changing slope values for both lines, with the function expression and Δx value labeled.
The prompt above was compiled from the original drawing commands and is for reference only.