
Definition of Functions and Their Graphs
Loading the math board and drawing, please wait…
In collections
数式処理(CAS) を学ぶ
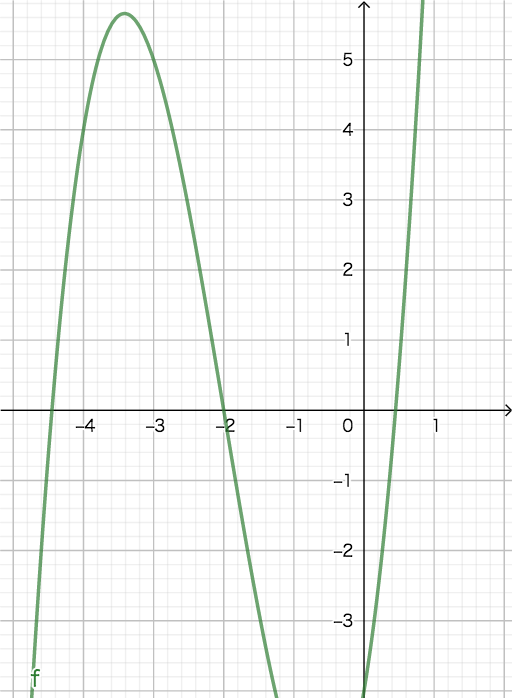
This example demonstrates the fundamental definition of functions and their graphical representations. Through dynamic GeoGebra visualization, learners can intuitively understand the core concept of functions: for each independent variable x in the domain, there is a unique corresponding function value f(x). The core mathematical concepts involved include domain, range, mapping relationships, and how to plot function graphs. Construction points: Using GeoGebra commands to plot the function f(x), dynamically demonstrating the correspondence between independent variable x and dependent variable f(x), and observing the characteristics of the function graph. Suitable for middle school to high school mathematics learners, serving as an intuitive teaching tool for introductory function lessons or for reviewing basic function concepts.
GeoGebra Commands & Parameters
x^(3) + (6 * x^(2)) + (6 * x) - 4NSolve(f = 0)f({-5, 0, 2.15})NSolve(f = 4)
AI Drawing Prompt Reference
On a single coordinate plane, define and plot the function f(x)=x^3+6x^2+6x-4. Then emphasize key input–output correspondences by marking the solutions where f(x)=0 on the graph. Also mark the points corresponding to inputs −5, 0, and 2.15 (so the y-coordinates are f(−5), f(0), and f(2.15)). Finally, determine and mark the solutions where f(x)=4. Use these highlighted points together with the curve to visually show the mapping from each x to its unique function value f(x).
The prompt above was compiled from the original drawing commands and is for reference only.