
Definite Integral Estimates
Loading the math board and drawing, please wait…
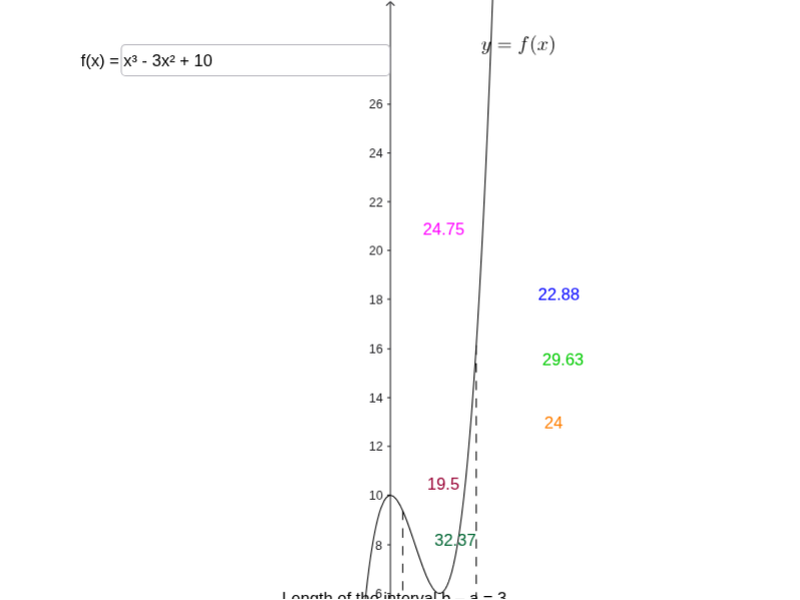
This example demonstrates how different choices for rectangle heights in the definition of a definite integral lead to varying estimates. It involves core concepts like definite integrals, probability, ratios, plane figures, subtraction, and confidence intervals. Constructed using GeoGebra commands and objects such as Point, Segment, Integral, RectangleSum, LowerSum, UpperSum, and Textfield. Suitable for high school and above to understand the geometric interpretation and estimation methods of definite integrals.
GeoGebra Commands & Parameters
Point(xAxis) → aPoint(xAxis) → bSegment(a, (x(a), f(x(a)))) → cSegment(b, (x(b), f(x(b)))) → dIntegral(f, x(a), x(b)) → sRectangleSum(f, x(a), x(b), n, 0) → l_nRectangleSum(f, x(a), x(b), n, 1) → r_nRectangleSum(f, x(a), x(b), n, k) → s_nLowerSum(f, x(a), x(b), n) → LSUpperSum(f, x(a), x(b), n) → USTextfield(f) → inputBox2Segment(a, b) → g
AI Drawing Prompt Reference
Draw a function graph in a coordinate system and mark two points a and b on the x-axis. Connect a to the function's point at a to form segment c, and connect b to the function's point at b to form segment d. Calculate the definite integral of the function over the interval from a to b. Use n rectangles to approximate the integral from below and above, showing lower sum LS and upper sum US. Demonstrate different integral estimation methods by adjusting rectangle heights, including left sum l_n, right sum r_n, and general sum s_n. Label the function expression and explanatory text nearby, and connect a and b with segment g.
The prompt above was compiled from the original drawing commands and is for reference only.