
Decimal Number Visualizer - Tenths
Loading the math board and drawing, please wait…
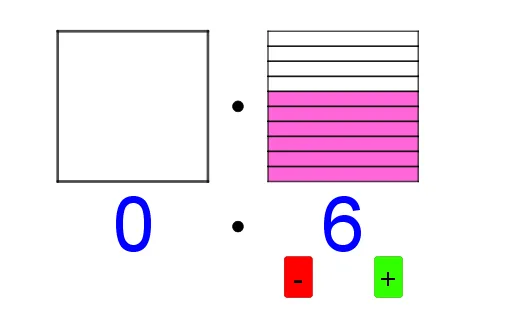
This example visually demonstrates the concept of tenths in decimal numbers. It involves the representation of decimal numbers and their conversion to fractions. Using commands like Point, Polygon, Circle, etc., from the construction summary, one can understand how to use GeoGebra for geometric construction. Suitable for high-grade elementary and junior high school students.
GeoGebra Commands & Parameters
Point(yAxis) → APoint(yAxis) → BPoint(xAxis) → CPolygon(A, B, C, D) → q1, a, b, c, dPoint(xAxis) → EPoint(xAxis) → HPolygon(F, I, J, G) → tenths2, f_1, i, j, g_1Polygon(I, K, L, J) → tenths3, i_1, k, l, j_1Polygon((7, 1.5), (7, 2), (12, 2), (12, 1.5)) → tenths4, s, tenths4_1, h_1, k_1Polygon((7, 2.5), (7, 3), (12, 3), (12, 2.5)) → tenths6, m, p, q, rPolygon((7, 2), (7, 2.5), (12, 2.5), (12, 2)) → tenths5, l_1, m_1, n_1, p_1Polygon((7, 4), (7, 4.5), (12, 4.5), (12, 4)) → tenths9, q_1, r_1, s_1, t_1Polygon((7, 4.5), (7, 5), (12, 5), (12, 4.5)) → tenths10, a_1, b_1, c_1, d_1Polygon((7, 3.5), (7, 4), (12, 4), (12, 3.5)) → tenths8, e_1, f_2, g_2, h_2Polygon((7, 3), (7, 3.5), (12, 3.5), (12, 3)) → tenths7, i_2, j_2, k_2, l_2Polygon(G, F, E, H) → tenths1, g_5, f_5, e, h_5Circle(M, 0.1) → c_4
AI Drawing Prompt Reference
Draw a decimal number visualizer showing the concept of tenths. Start by creating points A and B on the y-axis, then create points C and E on the x-axis. Use these four points to draw a polygon. Next, create points F, H, and G on the x-axis and use them to draw multiple polygons to represent tenths. Finally, draw a circle with center M and radius 0.1.
The prompt above was compiled from the original drawing commands and is for reference only.