
Decadic Logarithm Function Graph Demo
Loading the math board and drawing, please wait…
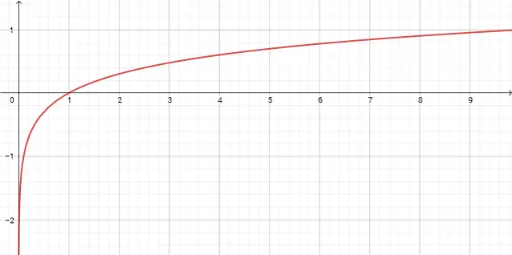
This example demonstrates the graph of the decadic logarithm function y=lg(x) and its properties. It involves core math concepts like logarithmic functions, function graphs, symmetry, derivatives, square operations, and general quadrilaterals. GeoGebra commands objects f and g are used to define functions and shapes. Suitable for high school students learning logarithmic function properties and analytical geometry construction.
GeoGebra Commands & Parameters
f: y = log(x)g: y = lg(x)