
Custom base logarithm visualisation
Loading the math board and drawing, please wait…
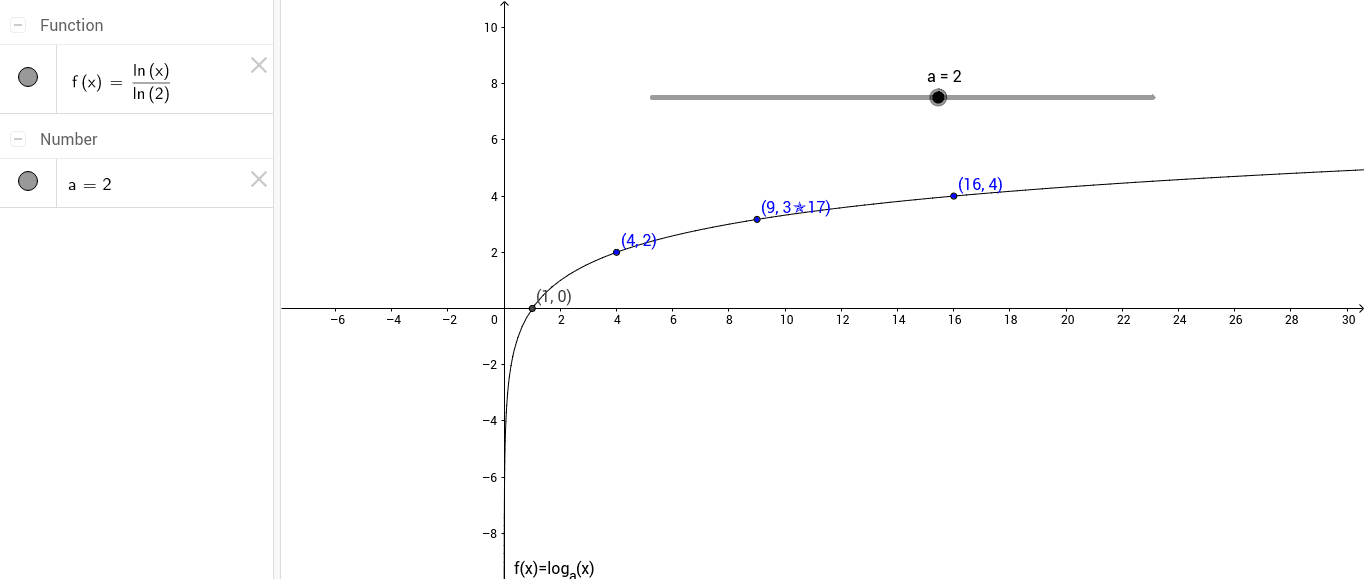
This example demonstrates how to visualize logarithmic functions with custom bases using GeoGebra. Key mathematical concepts include logarithmic function properties, geometric transformations, and linear equations. Construction involves using the Intersect command to determine intersection points and utilizing objects a, f, B, A, C, D. Suitable for high school students learning logarithmic function transformations or for geometric construction and function analysis in educational settings.
GeoGebra Commands & Parameters
Intersect(f, xAxis, (1, 0)) → BIntersect(f, Line[(4, 0), (4, 1)], (4, 2)) → AIntersect(f, Line[(9, 0), (9, 1)], (9, 3.1699250014423126)) → CIntersect(f, Line[(16, 0), (16, 1)], (16, 4)) → D
AI Drawing Prompt Reference
Draw a graph featuring a logarithmic function with a custom base. Include a logarithmic curve, a vertical line segment, and a horizontal line segment. The curve intersects the vertical line segment at one point and the horizontal line segment at another point. The vertical and horizontal line segments form two intersection points above the curve. The graph should clearly show the shape and transformation of the logarithmic function, suitable for learning logarithmic properties and geometric construction.
The prompt above was compiled from the original drawing commands and is for reference only.