
Curves and Stationary Points
Loading the math board and drawing, please wait…
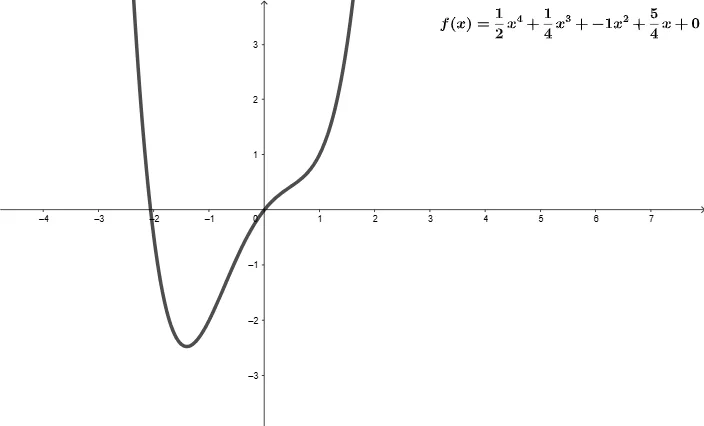
This example demonstrates how to analyze the shape of function curves and locate their stationary points using GeoGebra. Key math concepts include derivatives, function extrema, and analytical geometry. It leverages commands like Intersect, FractionText, If, and Segment, along with objects such as segments and points, to construct the visualization. Ideal for high school and above students studying calculus, function analysis, and mathematical modeling.
GeoGebra Commands & Parameters
Intersect(f', xAxis) → A, B, CIntersect(f'', xAxis) → D, EFractionText(a) → faFractionText(b) → fbFractionText(c) → fcFractionText(d) → fdFractionText(e) → feFractionText((a * 4)) → ffaFractionText((3 * b)) → ffbFractionText((2 * c)) → ffcFractionText(d) → ffdFractionText(((4 * 3) * a)) → fffaFractionText(((3 * 2) * b)) → fffbFractionText((2 * c)) → fffcIf(Defined[SP1], If[Defined[SP2], If[Defined[SP3], 3, 2], 1], 0) → spsIf(Defined[PI1], If[Defined[PI2], 2, 1], 0) → pisSegment(SP1, A) → f_1Segment(SP2, B) → g_{2}Segment(SP3, C) → g_1Segment(PI1, D) → h_1Segment(PI2, E) → i_1