
Cube Root Function Graph by Michael Bailey
Loading the math board and drawing, please wait…
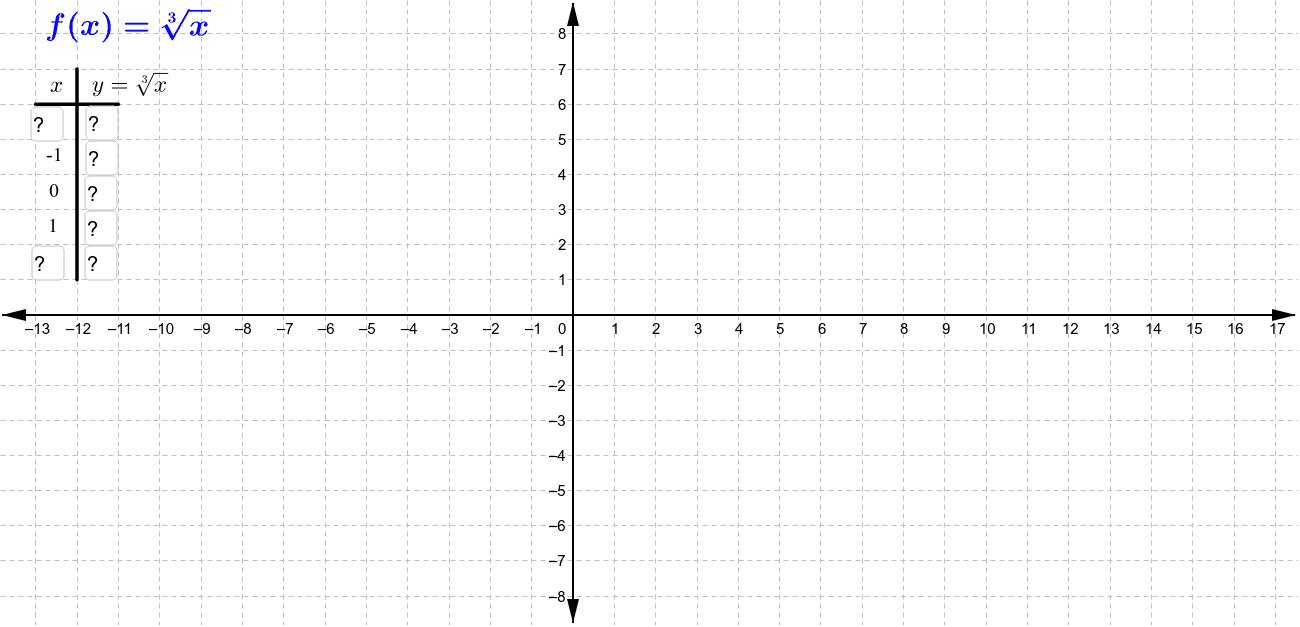
This example demonstrates the graph of the cube root function. It involves the core mathematical concepts of functions and coordinate geometry. Using GeoGebra commands such as Segment, CurveCartesian, Point, etc., the function graph can be dynamically displayed. Suitable for high school mathematics education and learning.
GeoGebra Commands & Parameters
Segment(A, B) → aSegment(C, D) → bCurveCartesian(t, cbrt(t), t, -8.1, 8.1) → cPoint(c) → EPoint(c) → GVector(G, H) → vTextfield(a1) → inputBox1Textfield(a2) → inputBox2Textfield(a3) → inputBox3Textfield(a4) → inputBox4Textfield(a5) → inputBox5Textfield(a6) → inputBox6Textfield(a7) → inputBox7Point(c) → IVector(I, J) → u
AI Drawing Prompt Reference
Draw the graph of the cube root function, including two points E and G, and the vector v connecting them. Use parameter t ranging from -8.1 to 8.1 to plot curve c, which represents the cube root function. Create point I on the curve and represent the vector u from I to J.
The prompt above was compiled from the original drawing commands and is for reference only.