
Counting Socks: Absolute Frequency Statistics Practice
Loading the math board and drawing, please wait…
In collections
Wiederholung: absolute, relative & prozentuelle Häufigkeit
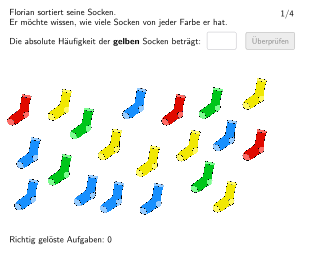
This GeoGebra example lets students practice determining absolute frequencies by counting how many socks Florian has. The core mathematical concept is absolute frequency - the number of times a particular value occurs in a dataset. Based on the construction summary, the activity uses Textfield, Polygon, Shuffle commands along with count, InputBox, and validation buttons to create an interactive counting exercise. Students enter their answer and click validate to receive immediate feedback. Designed for grade 5-6 students (German Schulstufe 5-6), this activity is ideal for introducing basic statistical concepts and counting skills in early math education.
GeoGebra Commands & Parameters
Textfield(aInput) → InputBox1Polygon(PtopLeftCornerFeedback, PtopRightCornerFeedback, PbottomRightCornerFeedback, PbottomLeftCornerFeedback) → rectangleCorrect, ptopleftcornerfeedback, ptoprightcornerfeedback, pbottomrightcornerfeedback, pbottomleftcornerfeedbackShuffle(pointList) → shuffledPointList, {(2.989327570998681, 3.6161227566110696), (-1.473610352775845, 5.650697398331832), (0, 5), (1.5782516098052646, 5.6014738182902), (4.154285631983943, 7.619640599997085), (-3.4261456944272, 7.19303623963628), (1, 7), (-5, 7), (4.154285631983943, 5.6342895383179545), (2.1361188502770827, 4.387292177263295), (-2.5729369737055996, 6.471090399025687), (-3.4261456944272, 4.666225797499205), (2.447868190540742, 7.258667679691788), (-1.3915710527064604, 3.5997148965971926), (0.1507677885979714, 3.5340834565416843), (3, 6), (-2.4088583735668303, 3.8622406568192265), (-0.5219544719709829, 7.242259819677911), (-4.722366635523478, 3.6981620566804554), (-4.640327335454093, 5.3225401980542895)}Shuffle(shuffledPointList) → l1, {(-2.5729369737055996, 6.471090399025687), (1.5782516098052646, 5.6014738182902), (-3.4261456944272, 7.19303623963628), (-1.473610352775845, 5.650697398331832), (-4.640327335454093, 5.3225401980542895), (-5, 7), (3, 6), (-3.4261456944272, 4.666225797499205), (2.989327570998681, 3.6161227566110696), (2.447868190540742, 7.258667679691788), (0.1507677885979714, 3.5340834565416843), (4.154285631983943, 7.619640599997085), (-4.722366635523478, 3.6981620566804554), (2.1361188502770827, 4.387292177263295), (-0.5219544719709829, 7.242259819677911), (0, 5), (1, 7), (-1.3915710527064604, 3.5997148965971926), (-2.4088583735668303, 3.8622406568192265), (4.154285631983943, 5.6342895383179545)}
AI Drawing Prompt Reference
Draw a coordinate system with 10 points randomly distributed in a rectangular area. Students will practice the concept of absolute frequency by counting the occurrences of each point. Start by drawing a rectangular area, then randomly generate 10 points and display them within the area. Finally, ask students to input their count of each point and use a validation button to check their answers.
The prompt above was compiled from the original drawing commands and is for reference only.