
Correlation Example
Loading the math board and drawing, please wait…
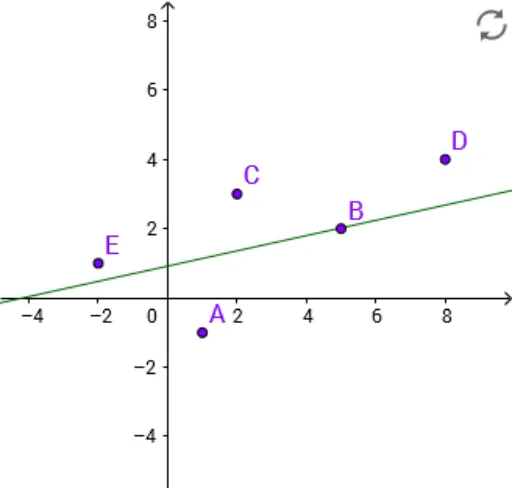
This example demonstrates the linear correlation between data points. Key mathematical concepts include correlation coefficient, standard deviation, and probability & statistics. Using the GeoGebra command FitLineY, the linear relationship between data points can be visually observed. Suitable for high school mathematics education and students learning probability & statistics.
GeoGebra Commands & Parameters
FitLineY({A, B, C, E}) → a