
Correlation Coefficient Explorer (with Z points)
Loading the math board and drawing, please wait…
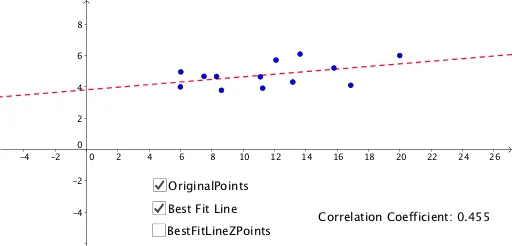
This example demonstrates how to dynamically visualize and calculate the correlation coefficient using Z points. It involves core math concepts like correlation coefficient, linear functions, conditional probability, and geometric shapes (pie chart, trapezoid). Key GeoGebra commands used include SDX, SDY, MeanX, MeanY, PMCC, Element, FitLineY, with objects A to M and list1. Suitable for high school and above mathematics education, combining probability statistics with analytical geometry.
GeoGebra Commands & Parameters
SDX(list1) → StdevxSDY(list1) → stdevyMeanX(list1) → MnxMeanY(list1) → mnyPMCC(F1:F13) → CcElement(F1:F13, PickPoint) → PPointFitLineY(F1:F13) → iFitLineY({A, B, C, D, E, F, G, H, I, J, K, L, M}) → j
AI Drawing Prompt Reference
Create a dynamic visualization of the correlation coefficient featuring a set of data points and their corresponding histogram, showing how to derive the correlation coefficient through calculations of standard deviation, mean, and linear regression line, with pie charts and trapezoids as geometric aids for explanation, suitable for high school mathematics education integrating probability statistics with analytical geometry.
The prompt above was compiled from the original drawing commands and is for reference only.