
Correlation Coefficient and Best-Fit Line Interactive Demo
Loading the math board and drawing, please wait…
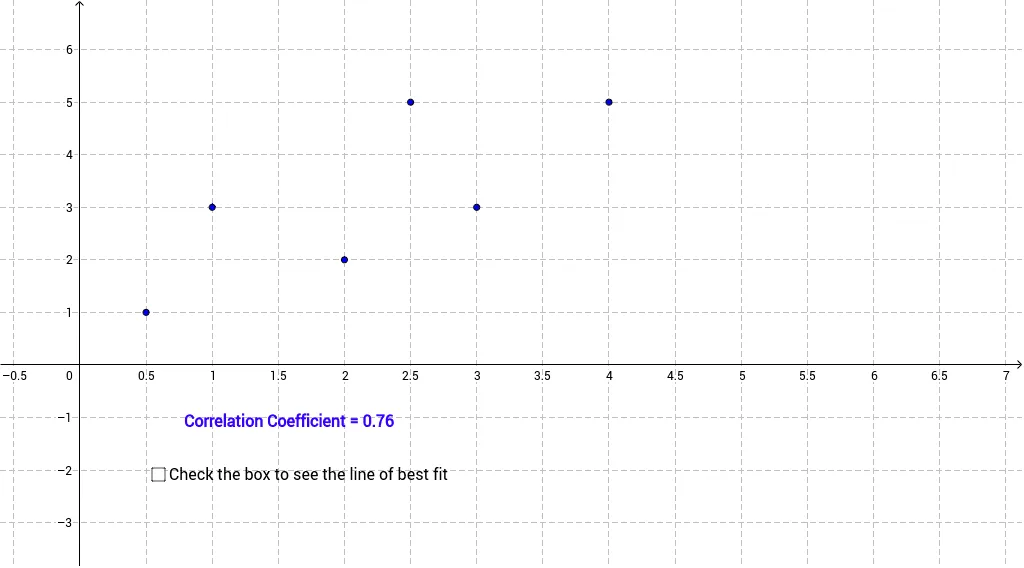
① This example demonstrates how dragging data points in a scatter plot dynamically updates the Pearson correlation coefficient (PMCC) and the best-fit line. ② Core math concepts include correlation, linear regression, least squares, and how data distribution affects statistical measures. ③ Construction uses GeoGebra commands PMCC for the correlation coefficient and FitLineY for the regression line, with a list (list1) storing points, text1 displaying the equation and coefficient, and movable points A–F controlling data positions. ④ Suitable for high school or introductory college statistics, helping students grasp the meaning of correlation strength and the behavior of outliers on regression.
GeoGebra Commands & Parameters
PMCC(list1) → rFitLineY(list1) → a
AI Drawing Prompt Reference
Create a scatter plot with draggable data points that dynamically shows the distribution of the points and a best-fit line. Include a linear regression line passing through the data points and a value displaying the Pearson correlation coefficient (PMCC). Observe how moving the data points affects the scatter plot, regression line, and the correlation coefficient to demonstrate how data distribution influences statistical measures.
The prompt above was compiled from the original drawing commands and is for reference only.