
Coordinate Geometry: Interpreting Graphs of Proportional Relationships
Loading the math board and drawing, please wait…
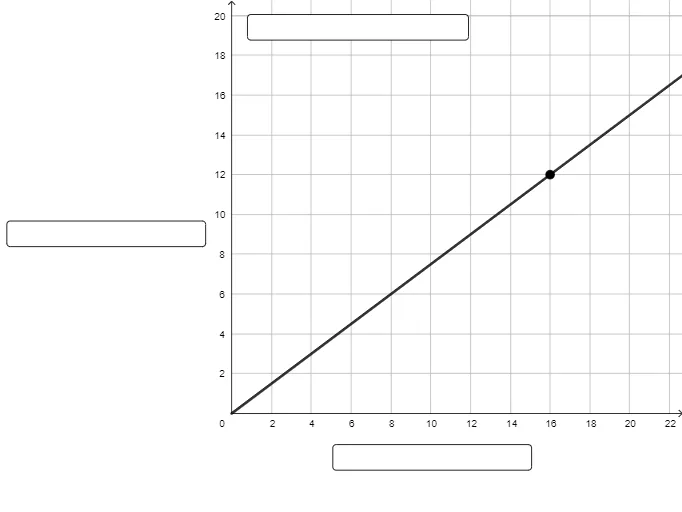
This example demonstrates how to interpret graphs of proportional relationships using coordinate geometry. Key mathematical concepts include proportional relationships and function graphs. GeoGebra commands used include: Textfield, Ray. Suitable for middle and high school students to learn about proportional relationships and function graphs.
GeoGebra Commands & Parameters
Textfield() → InputBox1Textfield() → InputBox2Ray(B, A) → fTextfield() → InputBox3
AI Drawing Prompt Reference
Draw a coordinate plane showing a graph of a proportional relationship. Start by placing three text input fields for entering the constant of proportionality, the x-value, and the y-value. Then construct a ray originating from the origin and extending into the first quadrant, representing the proportional function. The ray should pass through a point determined by the entered values, illustrating the direct variation. Clearly label the axes and grid, and make the ray and point update dynamically as the inputs change, demonstrating the linear relationship between variables.
The prompt above was compiled from the original drawing commands and is for reference only.