
Continuity versus Darboux Property for Real Functions
Loading the math board and drawing, please wait…
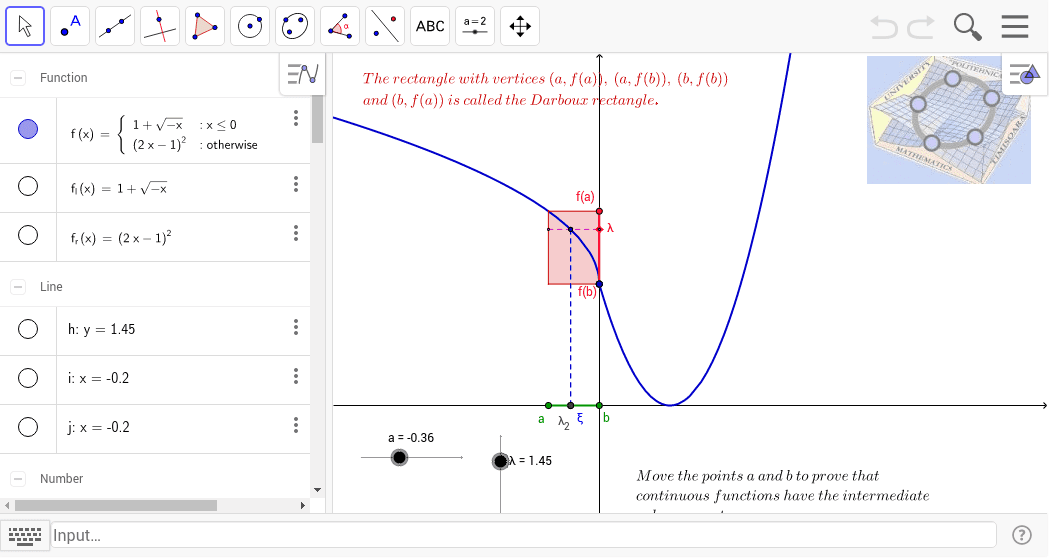
This GeoGebra example demonstrates the difference and relationship between continuity and the Darboux (intermediate value) property of a real function defined on an interval. The core mathematical concepts covered include real functions, intervals, continuity, the Darboux property, the intermediate value theorem, limits, and function graphs. Construction highlights: it employs GeoGebra commands such as If, Min, Max, Polygon, Segment, Line, and Intersect, along with objects including f, f_l, f_r, a, b, y_1, y_2, P, Q, R, S, poly1, and related variables, to construct piecewise function graphs, mark endpoints and extrema, draw segments and polygons, and compute intersection points. It is suitable for senior high school, undergraduate mathematical analysis, or advanced algebra courses, as well as classroom demonstrations and self-study, helping learners grasp that continuity implies the Darboux property, while the converse does not necessarily hold.
GeoGebra Commands & Parameters
If(x ≤ 0, f_l, f_r) → fMin(f(a), f(b)) → y_1Max(f(a), f(b)) → y_2Polygon(P, R, S, Q) → poly1, p, r, s, qSegment(A, B) → tSegment(R, S) → gSegment(fa, fb) → eLine(C, t) → hIntersect(f, h, (0.030000000345022, 0.8835999987027173)) → DIntersect(f, h, (-0.20250000000000012, 1.4500000000000002)) → ELine(D, e) → iLine(E, e) → jIntersect(j, t) → ξIntersect(i, t) → λ_2Segment(D, λ_2) → dSegment(E, D) → kSegment(E, ξ) → lIntersect(h, q) → HIntersect(h, r) → ISegment(H, I) → m
AI Drawing Prompt Reference
Draw a function graph on the interval [a, b] to illustrate the difference between continuity and the Darboux property. First, plot two segments of the function for x≤0 and x>0, marking the endpoints a and b, and the maximum and minimum values at a and b. Then, connect these key points with line segments and draw a closed polygon that includes the endpoints, extrema, and the function graph. Finally, draw two parallel lines intersecting the function graph at two points, and connect these intersection points to the function endpoints, forming two triangles that demonstrate the relationship between continuity and the Darboux property.
The prompt above was compiled from the original drawing commands and is for reference only.