
Confidence Interval Calculation Demo
Loading the math board and drawing, please wait…
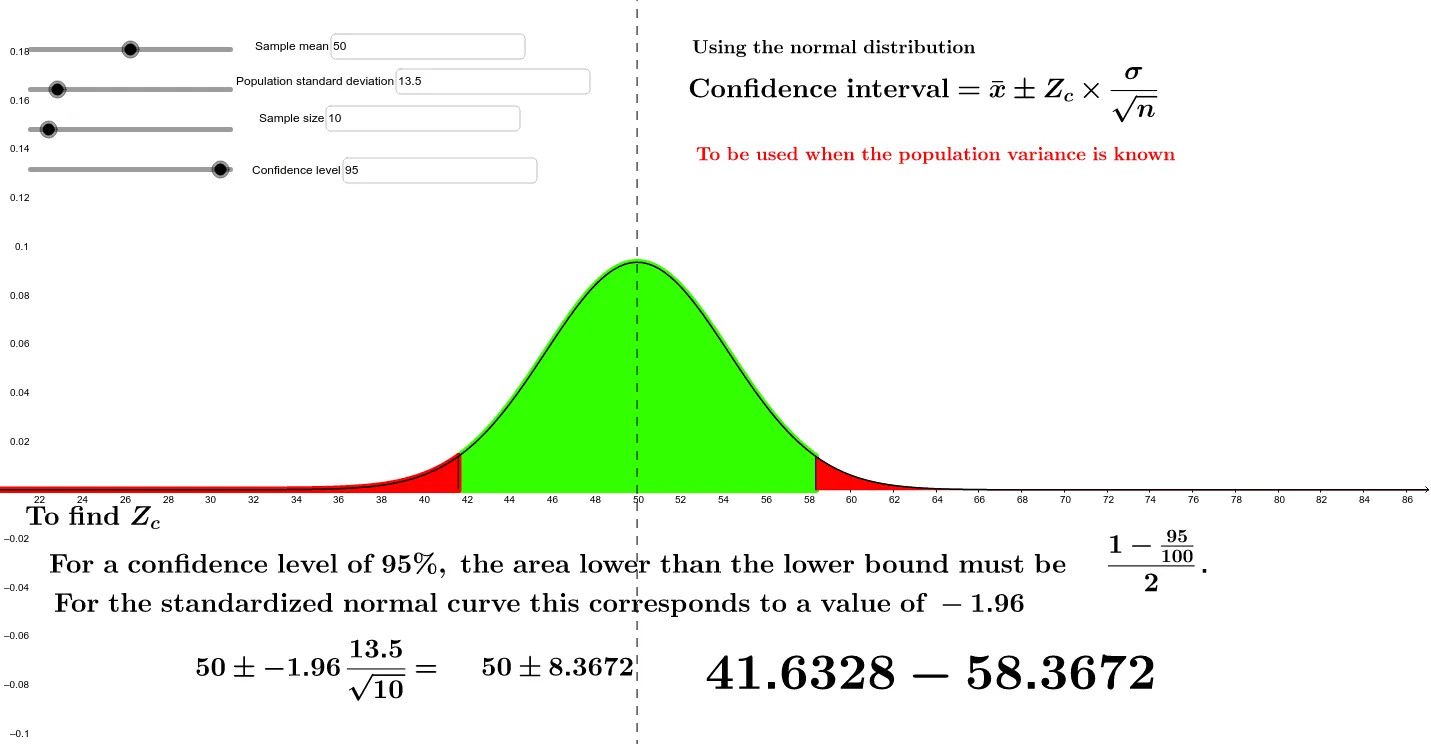
This example demonstrates how to calculate and visualize confidence intervals using GeoGebra. It involves core math concepts like normal distribution, inverse normal distribution, integral, matrix operations, orthocenter, and scalene triangles. Construction highlights include commands like Normal, InverseNormal, Integral, Segment, Textfield, and objects such as sample mean, population standard deviation, sample size, and confidence level. Suitable for high school and above students learning probability & statistics.
GeoGebra Commands & Parameters
Normal(samplemean, populationsd / samplesize^(0.5), x) → fInverseNormal(0, 1, (1 - (0.01 * confidence)) / 2) → bIntegral(f, x(B), x(A)) → eIntegral(f, -1.0E99, x(B)) → gIntegral(f, x(A), 1.0E99) → hSegment(A, D) → cSegment(B, C) → dTextfield(samplemean) → inputBox1Textfield(populationsd) → inputBox2Textfield(samplesize) → inputBox3Textfield(confidence) → inputBox4