
Confidence Interval and Matrix Application
Loading the math board and drawing, please wait…
In collections
Tessellations
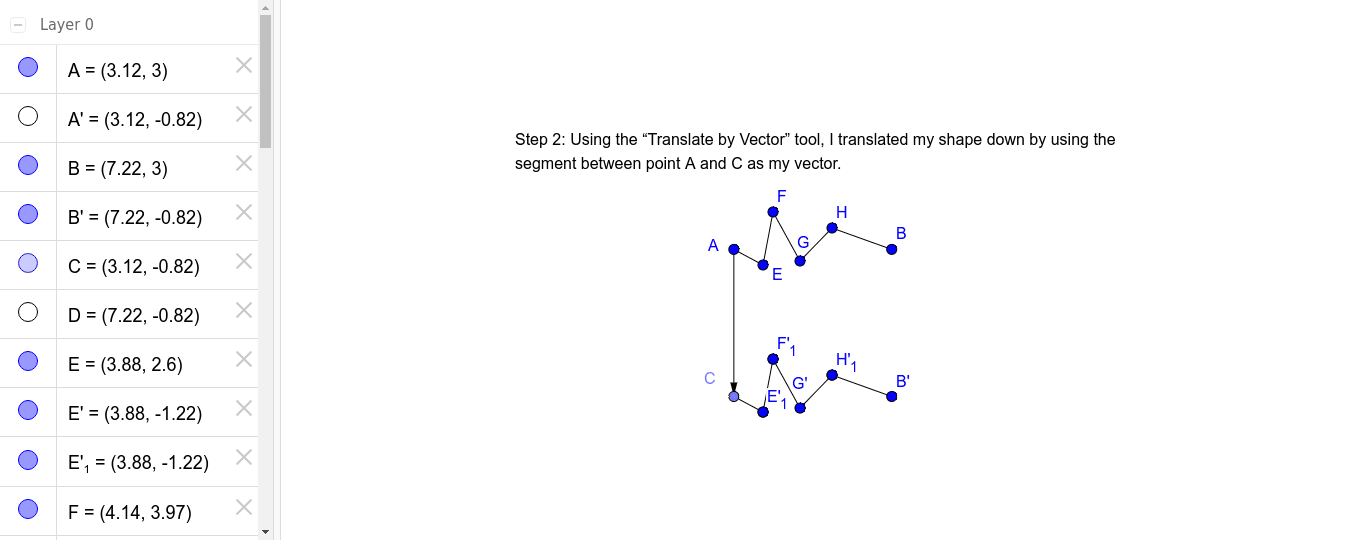
This example demonstrates how to use GeoGebra to draw confidence intervals and analyze mathematical relationships involving matrices, difference and slope, ratios, and diagrams. Key concepts include confidence intervals, matrix operations, difference and slope calculations, ratio analysis, and graphical plotting. Construction highlights involve commands like Segment, OrthogonalLine, Point, Intersect, Vector, Translate, and objects A, B, f, g, h, C, i, D, j, k, l, m, E, n, F, p, G, q, H, r, s, u, A', E', n', F', E_1, p', F_1, G', q', H', G_1, r', H_1, B', text1. Suitable for high school students and educators for teaching demonstrations and concept understanding.
GeoGebra Commands & Parameters
Segment(A, B) → fOrthogonalLine(A, f) → gOrthogonalLine(B, f) → hPoint(g) → COrthogonalLine(C, g) → iIntersect(h, i) → DSegment(A, B) → jSegment(A, C) → kSegment(C, D) → lSegment(B, D) → mSegment(A, E) → nSegment(F, E) → pSegment(F, G) → qSegment(H, G) → rSegment(H, B) → sVector(A, C) → uTranslate(A, u) → A'Translate(E, u) → E'Segment(A', E') → n'Translate(F, u) → F'Translate(E, u) → E'_1Segment(F', E'_1) → p'Translate(F, u) → F'_1Translate(G, u) → G'Segment(F'_1, G') → q'Translate(H, u) → H'Translate(G, u) → G'_1Segment(H', G'_1) → r'Translate(H, u) → H'_1Translate(B, u) → B'Segment(H'_1, B') → s'