
Cone, Percentages, Linear Programming, Linear Regression, Tangent Line Demo
Loading the math board and drawing, please wait…
In collections
Symmetry, Transformation and Tessellation
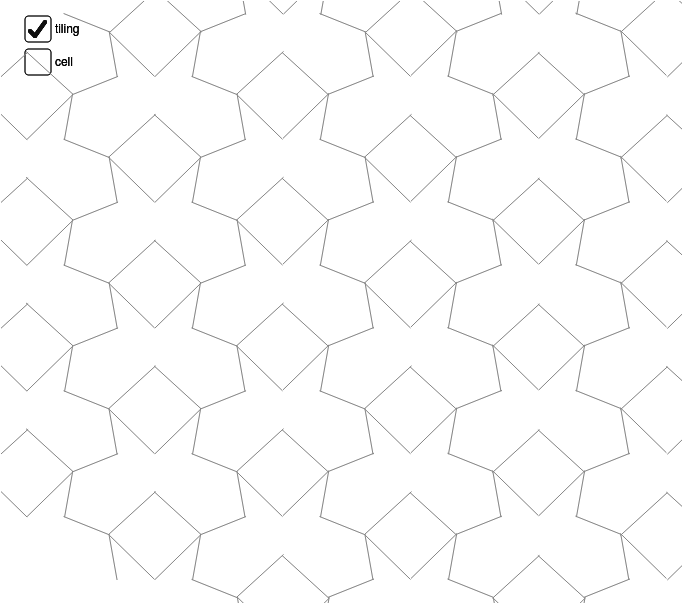
This example demonstrates geometric constructions of cones, percentage calculations, linear programming and regression analysis, and tangent line drawing. It involves core concepts like cone volume calculation, linear programming model setup, linear regression equation fitting, and tangent equation solving. Construction highlights include using GeoGebra commands/objects such as Point, Mirror, Midpoint, Vector, Segment, Sequence, and Line. Suitable for high school and above learners to understand interdisciplinary mathematical applications.
GeoGebra Commands & Parameters
Point(j) → BMirror(B, xAxis) → CMidpoint(A, B) → EMidpoint(B, D) → FMidpoint(D, C) → GMidpoint(C, A) → HMidpoint(C, B) → IVector(A, B) → uVector(A, C) → vVector(C, D) → wVector(B, D) → aSegment(H, F) → bSegment(E, G) → cSegment(J, K) → eSegment(K, L) → fSegment(K, M) → gSegment(K, N) → hMirror(cell1, j) → cell2Sequence(Translate[Sequence[Translate[tile, Vector[(n * u)]], n, -3, 3], Vector[(m * v)]], m, -3, 3) → tilingLine(H, E) → kLine(G, F) → lSegment(C, B) → n
AI Drawing Prompt Reference
Draw a cone to demonstrate volume calculation, linear programming, linear regression, and tangent lines. Construct the base and side of the cone using points, midpoints, and vectors. Connect these points with line segments to form the base and side. Add linear regression and tangent lines, and label key points and segments to highlight mathematical applications.
The prompt above was compiled from the original drawing commands and is for reference only.