
Complex Number Operations Investigation: Polar and Cartesian Visualization
Loading the math board and drawing, please wait…
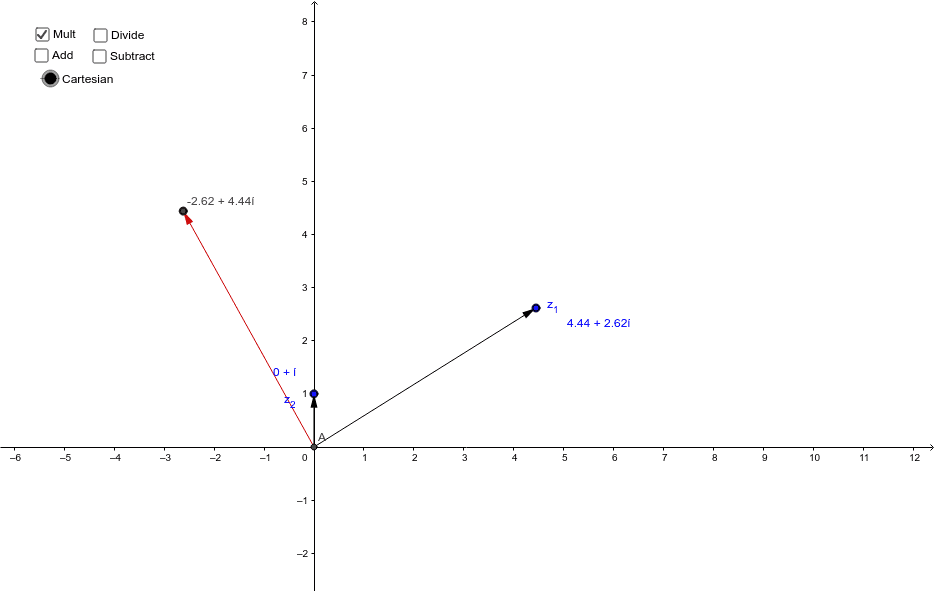
This GeoGebra example dynamically visualizes complex number operations in both polar and Cartesian coordinate systems, demonstrating the geometric meaning of addition, multiplication, and other operations. Core mathematical concepts include algebraic and polar forms of complex numbers, modulus and argument, and the correspondence between complex arithmetic and vector transformations. Construction highlights: uses Intersect command to find intersection points, Vector command to create vectors, and defines numerous complex objects (z_1 to z_14) along with auxiliary points and text labels, allowing interactive dragging to observe result changes. Suitable for high school to early university students to grasp the geometric essence of complex operations, and useful for classroom demonstrations or self-study, bridging complex numbers with plane geometry and vectors.
GeoGebra Commands & Parameters
Intersect(xAxis, yAxis) → AVector(A, z_1) → uVector(A, z_2) → vVector(A, z_3) → wVector(A, z_1) → zVector(A, z_2) → a_1Vector(A, z_3) → bVector(z_4, z_7) → dVector(z_5, z_7) → eVector(A, z_7) → fVector(A, z_7) → hVector(z_1, z_1 - z_2) → iVector(A, z_11) → jVector(A, z_11) → lVector(A, z_13) → mVector(A, z_13) → n
AI Drawing Prompt Reference
Draw a complex plane with the origin as the starting point, using arrow vectors to represent multiple complex numbers. First, draw vectors for two basic complex numbers, then draw vectors for their sum, difference, and product, using different colors to distinguish them. Next, mark several auxiliary points on the plane and draw vectors from these points to show geometric transformations of complex operations, such as rotation and scaling. Finally, add text labels to explain the meaning of each vector, and allow dragging key points to dynamically observe changes in the results.
The prompt above was compiled from the original drawing commands and is for reference only.