
Complex Function w = z²
Loading the math board and drawing, please wait…
In collections
complex-numbers
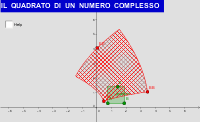
This example demonstrates the graph of the complex function w = z². Key mathematical concepts include complex numbers and power functions. Using GeoGebra commands such as polygon, point, and locus, the graph on the complex plane is shown. Suitable for high school mathematics education and learning.
GeoGebra Commands & Parameters
Polygon((0, 0), (2, 0), (2, 2), (0, 2)) → poli1, a, b, d, ePointIn(poli1) → APointIn(poli1) → BPolygon(A, B, 4) → quadrato, c, f, g, h, C, DPoint(quadrato) → ELocus(EE, E) → luogo1
AI Drawing Prompt Reference
Draw the graph of the complex function w = z² on the complex plane. Start with a square whose lower-left corner is at the origin and side length 2, with vertices on the axes. Pick two random points inside this square, and use them as adjacent vertices to construct a smaller square. Take a moving point on the boundary of this smaller square, and trace the image of this point under the squaring transformation. The result is a closed curve showing the image of the square's boundary under the complex square map. The final figure includes the original large square, the inner small square, and the traced curve, illustrating the geometric effect of the complex power function.
The prompt above was compiled from the original drawing commands and is for reference only.