
Comparing Boxplots
Loading the math board and drawing, please wait…
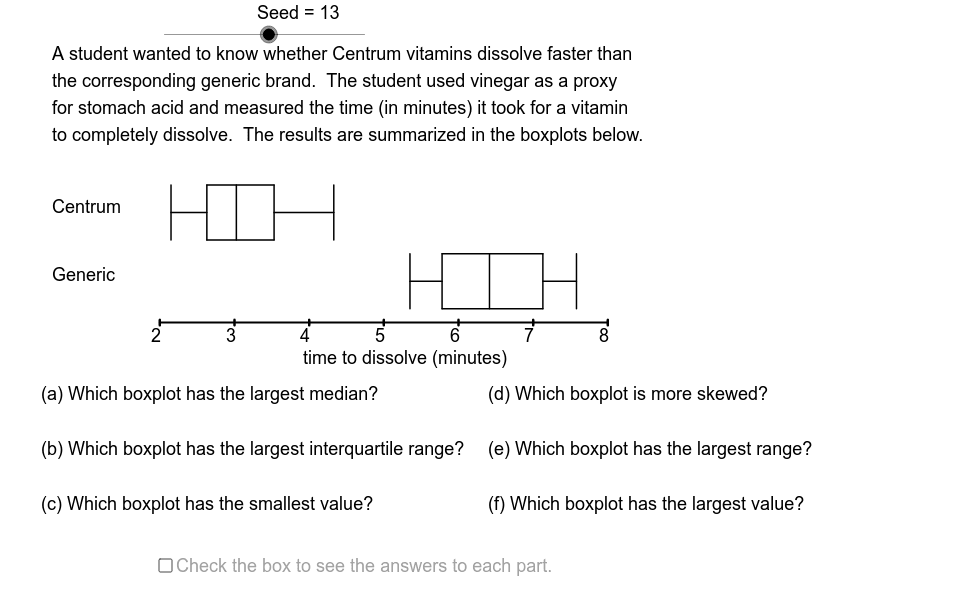
This applet provides several pairs of boxplots for students to compare various aspects. Using GeoGebra commands, students can understand the construction and statistical significance of boxplots. Suitable for middle school and above students learning statistics.
GeoGebra Commands & Parameters
Element(BDtSq, Data) → BDatQ3(BDat) → BQ3Q1(BDat) → BQ1KeepIf(BLF ≤ x ≤ BUF, BDat) → BGDMax(BGD) → BNMaxMin(BGD) → BNMinIf(BRWL / BLWL < 1, BLWL / BRWL, BRWL / BLWL) → BWRMedian(BDat) → BMedIf(BRBL / BLBL < 1, BLBL / BRBL, BRBL / BLBL) → BBRMin(BDat) → BMinMax(BDat) → BMaxElement(ADatSq, Data) → ADatMedian(ADat) → AMedMin(ADat) → AMinMin(AMin, BMin) → CMinMax(ADat) → AMaxMax(AMax, BMax) → CMaxIf(5 * LBScl ≤ UBScl, 5 * LBScl, If[2 * LBScl ≤ UBScl, 2 * LBScl, LBScl]) → SclQ1(ADat) → AQ1Q3(ADat) → AQ3If(ARBL / ALBL < 1, ALBL / ARBL, ARBL / ALBL) → ABRKeepIf(ALF ≤ x ≤ AUF, ADat) → AGDMin(AGD) → ANMinMax(AGD) → ANMaxIf(ARWL / ALWL < 1, ALWL / ARWL, ARWL / ALWL) → AWRElement(AcSq, Data) → AccSequence(k, k, CMin, CMax, 10^(-Acc)) → CDomainSort(Intersection[CDomain, BDat]) → BRangeSequence(k, k, BLF, BUF, 10^(-Acc)) → BMiddleCountIf(x < BLF, BRange) → BLOCCountIf(x ≤ BMax, BRange) → BCountSegment(LfEP, RtEP) → nmblnSegment(BNMin3, BNMin1) → newmin1Midpoint(newmin1) → BNMin2Segment(BQ13, BQ11) → qlo3Segment(BMed2, BMed1) → med2Midpoint(qlo3) → BQ12Segment(BNMin2, BQ12) → lwhSegment(BQ33, BQ31) → qhi3Segment(BQ13, BQ33) → boxtop2Segment(BQ11, BQ31) → boxbotSegment(BNMax3, BNMax1) → newmax2Midpoint(newmax2) → BNMax2Midpoint(qhi3) → BQ32Segment(BQ32, BNMax2) → rwh2Segment(ANMin3, ANMin1) → min4Segment(AQ11, AQ13) → qlo4Segment(AMed2, AMed1) → med4Segment(AQ33, AQ31) → qhi4Segment(AMax3, AMax1) → max4Segment(AQ11, AQ33) → boxtop4Segment(AQ13, AQ31) → boxbot4Midpoint(min4) → ANMin2Midpoint(qlo4) → AQ12Midpoint(qhi4) → AQ32Midpoint(max4) → AMax2Segment(ANMin2, AQ12) → lwh4Segment(AQ32, AMax2) → rwh4KeepIf(x < BLF, BRange) → BLOSequence((adapt(Element[BLO, k]), -0.8), k, 1, BLOC) → BLO2Element(GrpSeqA, Data) → GrpAElement(GrpSeqB, Data) → GrpBKeepIf(x < ALF, ADat) → ALOKeepIf(x > AUF, ADat) → AROKeepIf(x > BUF, BDat) → BROSort(Intersection[CDomain, ADat]) → ARngUnion(ARng, BRange) → CRangeCountIf(x ≤ AMax, ARng) → ACountCountIf(x < ALF, ARng) → ALOCCountIf(x > BUF, BRange) → BROCCountIf(x > AUF, ARng) → AROCSequence(k, k, ALF, AUF, 10^(-Acc)) → AMidSequence(k, k, BLE, BLF - 10^(-Acc), 10^(-Acc)) → BLeftElement(DesSeq, Data) → DD0Element(LabSeq, Data) → DtLbIf(AMax > BMax, 1, If[AMax < BMax, 2, 3]) → AnMaxIf(AMin > BMin, 1, If[AMin < BMin, 2, 3]) → AnMinElement(QsSqSq, Mod[Seed, 6] + 1) → QsNmSqIf(AWR > BWR + 0.05, 1, If[BWR > ABR + 0.05, 2, If[ABR > BBR + 0.05, 1, If[BBR > ABR + 0.05, 2, 3]]]) → AnSkwElement(AnSkwSq, AnSkw) → ExtAnSkwIf(AMed > BMed, 1, If[BMed > AMed, 2, 3]) → AnMedIf(ARng_1 > BRng + DF, 1, If[BRng > ARng_1 + DF, 2, 3]) → AnRngIf(AIQR > BIQR + DF, 1, If[BIQR > AIQR + DF, 2, 3]) → AnIQRElement(QsSq, Element[QsNmSq, 1]) → QAElement(QsSq, Element[QsNmSq, 2]) → QBElement(QsSq, Element[QsNmSq, 3]) → QCElement(QsSq, Element[QsNmSq, 4]) → QDElement(QsSq, Element[QsNmSq, 5]) → QEElement(QsSq, Element[QsNmSq, 6]) → QFElement(AnMaxSq, AnMax) → ExtAnMaxElement(AnMinSq, AnMin) → ExtAnMinElement(AnMedSq, AnMed) → ExtAnMedElement(AnRngSq, AnRng) → ExtAnRngElement(AnIQRSq, AnIQR) → ExtAnIQRElement(ExtAnSeq, Element[QsNmSq, 1]) → ExtAnAElement(ExtAnSeq, Element[QsNmSq, 2]) → ExtAnBElement(ExtAnSeq, Element[QsNmSq, 3]) → ExtAnCElement(ExtAnSeq, Element[QsNmSq, 4]) → ExtAnDElement(ExtAnSeq, Element[QsNmSq, 5]) → ExtAnEElement(ExtAnSeq, Element[QsNmSq, 6]) → ExtAnFSequence(Text[k, (adapt(k) - 1, -1.14)], k, AxMin, AxMax, Scl) → NmbLbSqSequence(Segment[(k * Stretch + 4, -1.08), (k * Stretch + 4, -1.06)], k, 0, AxMax - AxMin, Scl) → TicSq
AI Drawing Prompt Reference
Draw box plots for two sets of data, each including the minimum, first quartile, median, third quartile, and maximum. First, plot the minimum and maximum for each set, then the median and quartiles. Next, draw the box plots for both sets and compare their positions and shapes. Finally, draw the box plots for both sets, labeling the minimum, first quartile, median, third quartile, and maximum.
The prompt above was compiled from the original drawing commands and is for reference only.