
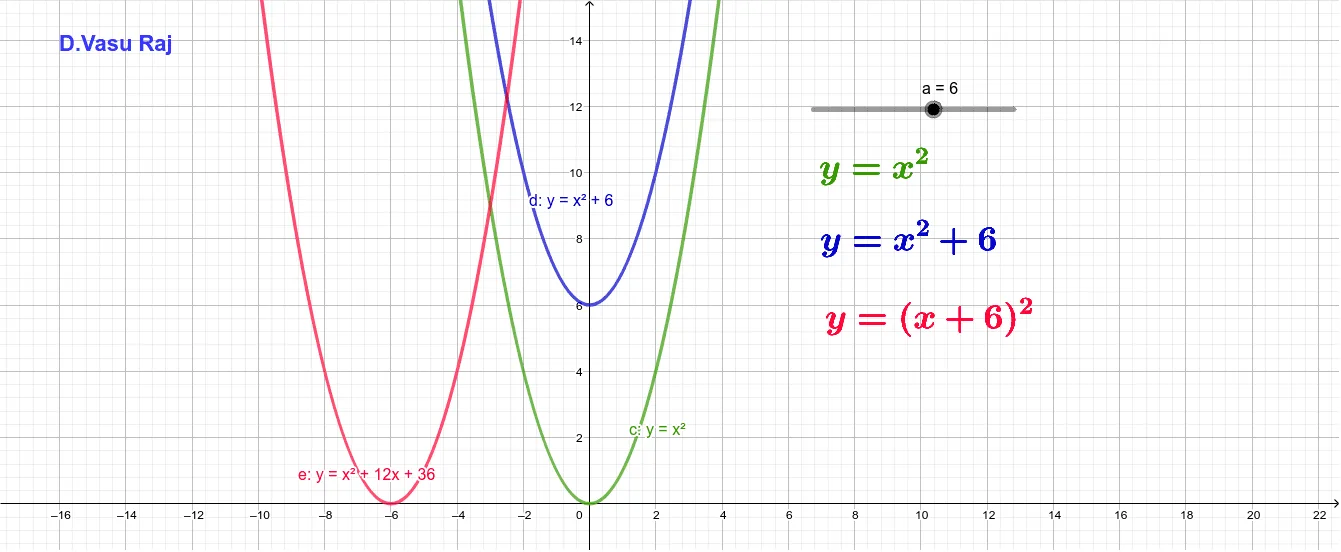
Compare Parabolas by Changing X-Coefficient and Constant
Loading the math board and drawing, please wait…
In collections
TRANSFORMATION OF FUNCTIONS
This example demonstrates how changing the x-coefficient and constant affects the parabola's graph dynamically. It involves core math concepts like quadratic function equations, properties of parabolas, and function graph transformations. Constructed using GeoGebra objects: sliders a (x-coefficient) and c (constant), and auxiliary objects d, e, plus text elements text1, text2, text3, text4 for explanations. Ideal for high school students to explore parameter influence on parabola shapes and for function graphing instruction.
GeoGebra Commands & Parameters
Numeric a(6.0)y = x^(2)y = x^(2) + ay = (x + a)^(2)