
Compare Normal Densities
Loading the math board and drawing, please wait…
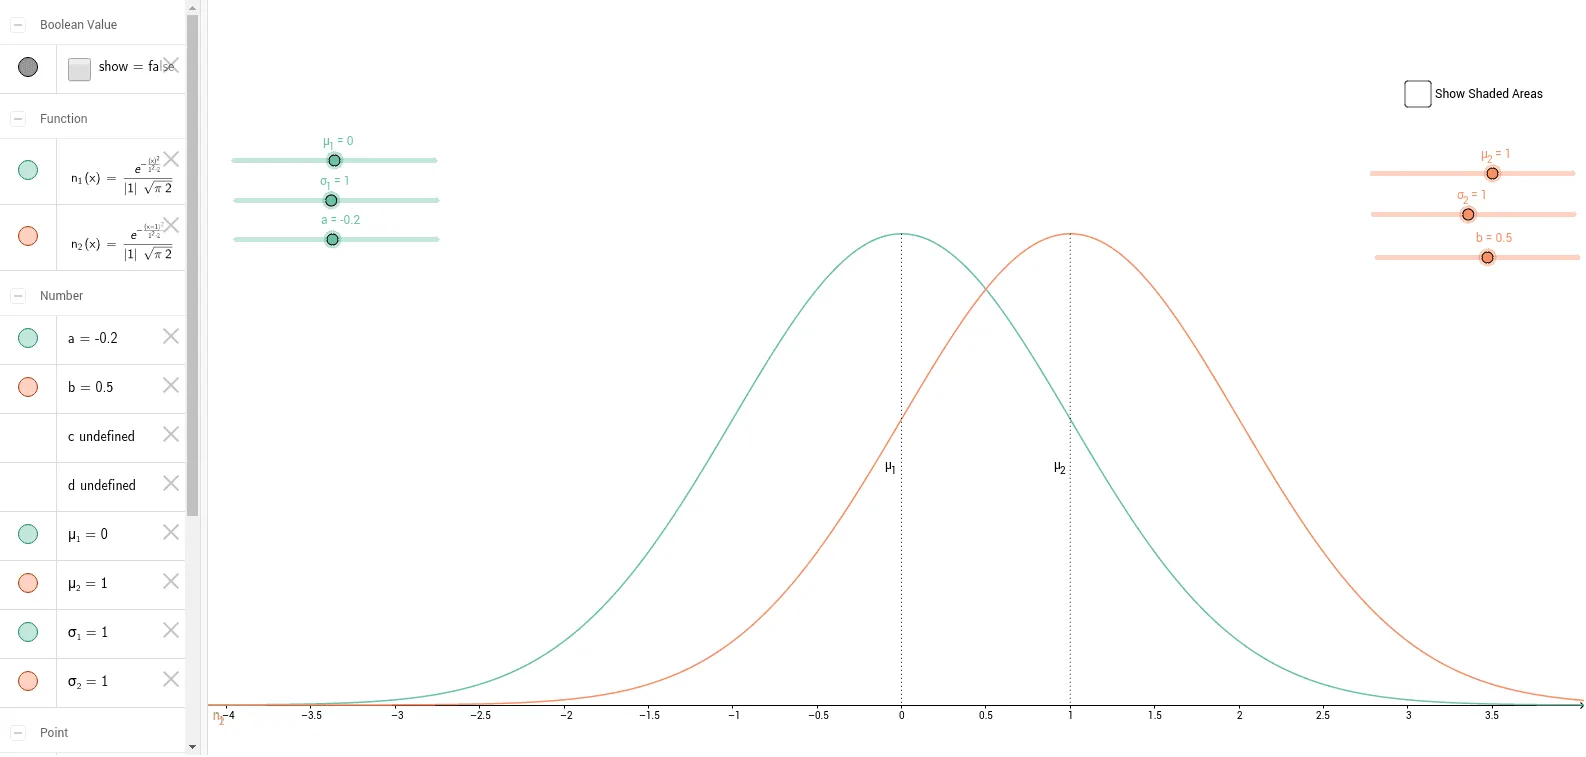
This example demonstrates how to compare two normal probability density functions through graphical methods. Key math concepts include normal distribution, probability density function, integral, mean, and standard deviation. GeoGebra commands used are Normal, Segment, and Integral to construct the visual comparison. Suitable for high school and above students learning probability & statistics.
GeoGebra Commands & Parameters
Normal(μ_1, σ_1, x) → n_1Normal(μ_2, σ_2, x) → n_2Segment(A, B) → s_aSegment(C, D) → s_bIntegral(n_1, -Infinity, a) → cIntegral(n_2, -Infinity, b) → d
AI Drawing Prompt Reference
Draw two normal probability density functions with mean μ1 set to 0 and standard deviation σ1 set to 1; mean μ2 set to 2 and standard deviation σ2 set to 0.5. Use segments to connect the start and end points of the two functions. Calculate and display the integrals of the two functions from negative infinity to points a and b.
The prompt above was compiled from the original drawing commands and is for reference only.