
Compare Box Plot and Dot Plot
Loading the math board and drawing, please wait…
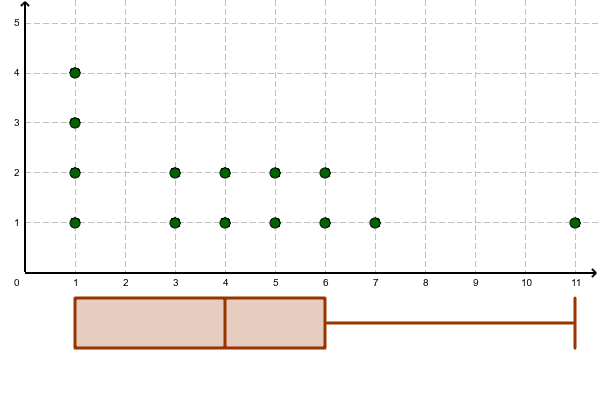
This example demonstrates the differences in data distribution through comparing box plots and dot plots. Key mathematical concepts include statistical data visualization methods. The DotPlot and BoxPlot commands in GeoGebra are used to construct two data lists. Suitable for middle school and above students or teachers to understand data central tendency and dispersion.
GeoGebra Commands & Parameters
DotPlot(list1) → list2BoxPlot(-1, 0.5, list1) → a
AI Drawing Prompt Reference
Create a dot plot and a box plot for a set of data. The dot plot shows the position of each data point, while the box plot displays the distribution range and central tendency. First, create the dot plot, then the box plot, to visually compare the differences between the two types of plots.
The prompt above was compiled from the original drawing commands and is for reference only.