
Class Activity: Weights of Boys Statistics
Loading the math board and drawing, please wait…
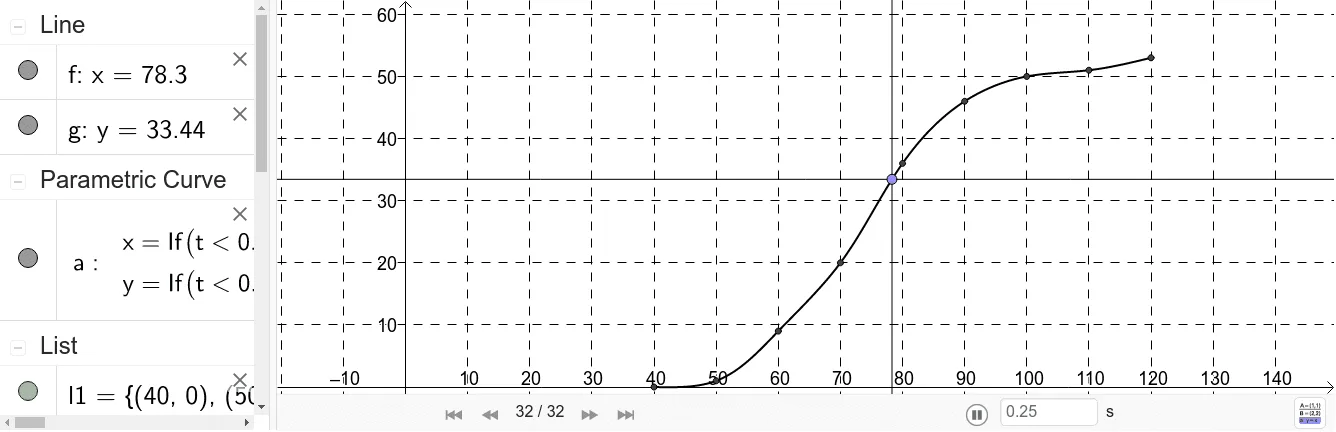
This example demonstrates how to plot a smooth spline curve based on boys' weight data using GeoGebra, involving core math concepts like statistics, rational numbers, cubes, right triangles, planes, and cylinders. Key GeoGebra commands and objects used include Spline, Point, and OrthogonalLine. Suitable for middle school and above, ideal for teaching statistical analysis and geometric constructions.
GeoGebra Commands & Parameters
Spline(l1, 3) → aPoint(a) → JOrthogonalLine(J, xAxis) → fOrthogonalLine(J, yAxis) → g