
Circular Functions Visualization
Loading the math board and drawing, please wait…
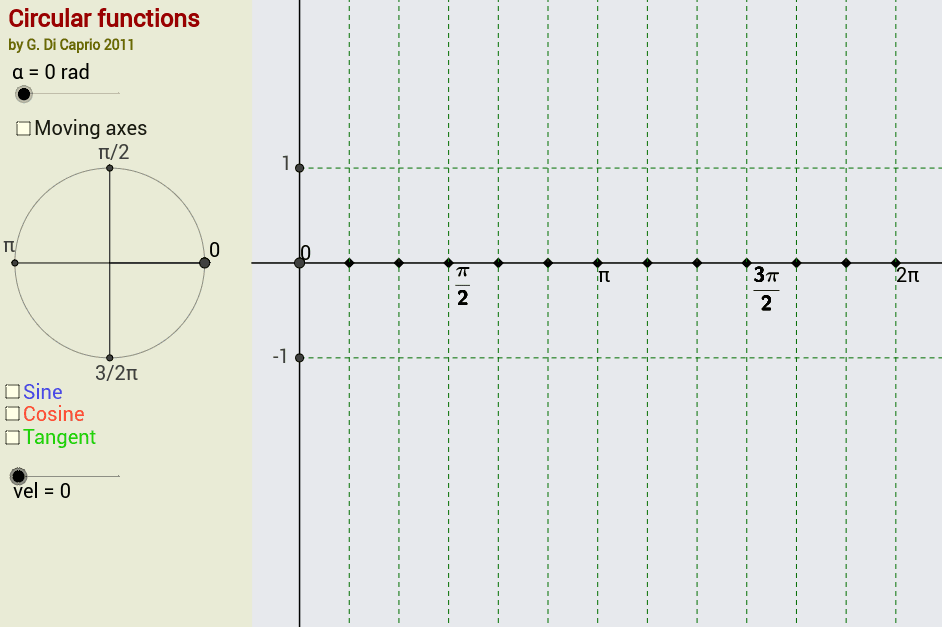
This example visualizes the definition of circular functions, focusing on sine and cosine. Using GeoGebra commands such as Rotate, Segment, and CircleArc, the relationship between angles and trigonometric values is dynamically demonstrated. Suitable for high school mathematics, particularly in trigonometry and coordinate geometry.
GeoGebra Commands & Parameters
If(moving, 1, 0) → movIf(moving, 1, 0) → mobileRotate(A, α, O) → PSegment(O, P) → aRotate(A, 1.5707963267948966, O) → A'Rotate(A', 1.5707963267948966, O) → A''Rotate(A'', 1.5707963267948966, O) → A'''Segment(A', A''') → bSegment(A'', A) → dSegment(C, P) → ssSegment(O, C) → ccSegment(B, D) → gCircleArc(O, A, P) → alphaAngle(A, O, P) → βSegment(O', AA) → eSegment(AA, PSeno) → fSequence(O' + (((2 * k) * 3.141592653589793 / n), 0), k, 1 - (mov * floor((((2 * 3.141592653589793) - α) * n / ((2 * 3.141592653589793))))), n - (mov * floor((((2 * 3.141592653589793) - α) * n / ((2 * 3.141592653589793)))))) → LLSegment(PCoseno, AA) → iVector(O, O') → vSegment(P, C) → jLine(P, O) → lIntersect(l, k) → TSegment(A, T) → mSegment(P, T) → hSegment(PTangente, AA) → qSegment(PPCos, PCoseno) → rSegment(PPSen, PSeno) → sSegment(PPTan, PTangente) → tSequence(Line[Element[LL, i], Element[LL, i] + (0, 1)], i, 1, n) → LRRay(U, U + (1, 0)) → a_1Ray(U', U' + (1, 0)) → b_1Function(Translate[sin(x), v], (mobile * (alpha - (2 * 3.141592653589793))) + x(v), alpha + x(v)) → fsFunction(Translate[cos(x), v], (mobile * (alpha - (2 * 3.141592653589793))) + x(v), alpha + x(v)) → fcFunction(Translate[tan(x), v], (mobile * (alpha - (2 * 3.141592653589793))) + x(v), alpha + x(v)) → ftPolygon(C1, C2, C3, C4) → poly1, c1, c2, c3, c4
AI Drawing Prompt Reference
Draw a unit circle centered at O and move a point P on the circle to demonstrate the relationship between angle α and point P's position. Use rotation and line segments to dynamically illustrate the definitions of sine, cosine, and tangent functions. First, draw circle O and rotate point A to get point P, then draw line segment a from O to P. Next, rotate A to get A', A'', and A''', and draw line segments b, d, ss, cc, and g. Use a circular arc to draw angle β and then rotate and draw line segments to illustrate sine and cosine values. Finally, rotate and draw line segments to illustrate the tangent value.
The prompt above was compiled from the original drawing commands and is for reference only.