
Chi-Squared Test Illustrated with Ellipses: Case-Control Counts Over Time
Loading the math board and drawing, please wait…
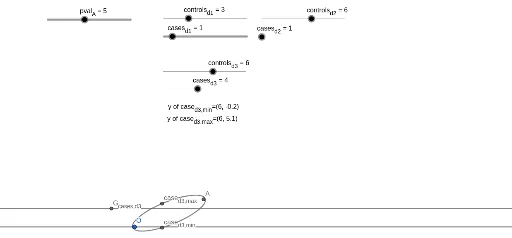
This GeoGebra example provides a visual illustration of the chi-squared test applied to case-control counts observed over multiple time points (d1 to d4). It uses ellipses and auxiliary geometric elements to represent the distribution of cases and controls, with interactive points A and B linked to statistical outputs such as p-values and chi-squared statistics. The core mathematical concepts include the chi-squared test, hypothesis testing, p-values, and the geometric interpretation of statistical significance. The construction employs GeoGebra commands such as Midpoint, Segment, OrthogonalLine, Circle, Intersect, Ellipse, and Line, creating objects like cases_d2, controls_d2, O, A, B, and various derived points and lines. This resource is suitable for high school or undergraduate statistics courses, offering an intuitive way to connect abstract statistical tests with geometric visualization, and helping learners grasp the relationship between test statistics and rejection regions.
GeoGebra Commands & Parameters
Midpoint(O, A) → X_{A}Segment(O, A) → f_{A}OrthogonalLine(X_{A}, f_{A}) → g_{A}Circle(X_{A}, (pval_{A} * 50 / 100)) → c_{A}Intersect(c_{A}, g_{A}, 2) → C_{A}Ellipse(O, A, C_{A}) → d_{A}Line(O, D_A) → h_{A}Line(E_A, F_A) → i_AIntersect(d_{A}, i_A, 2) → case_{d3,max}Intersect(d_{A}, i_A, 1) → case_{d3,min}Segment(O, B) → f_{B}Circle(B, (pval_{B} * 50 / 100)) → c_{B}OrthogonalLine(B, f_{B}) → g_{B}Midpoint(O, B) → X_{B}Intersect(c_{B}, g_{B}, 2) → C_{B}Ellipse(O, B, C_{B}) → d_{B}Line(E_{B}, F_{B}) → i_{B}Intersect(d_{B}, i_{B}, 2) → case_{d4,max}Intersect(d_{B}, i_{B}, 1) → case_{d4,min}Line(G_{cases,d3}, C_{cases,d3}) → fLine(G_{cases,d4}, C_{cases,d4}) → g