
Chi-Squared Goodness of Fit for One Coin Flip
Loading the math board and drawing, please wait…
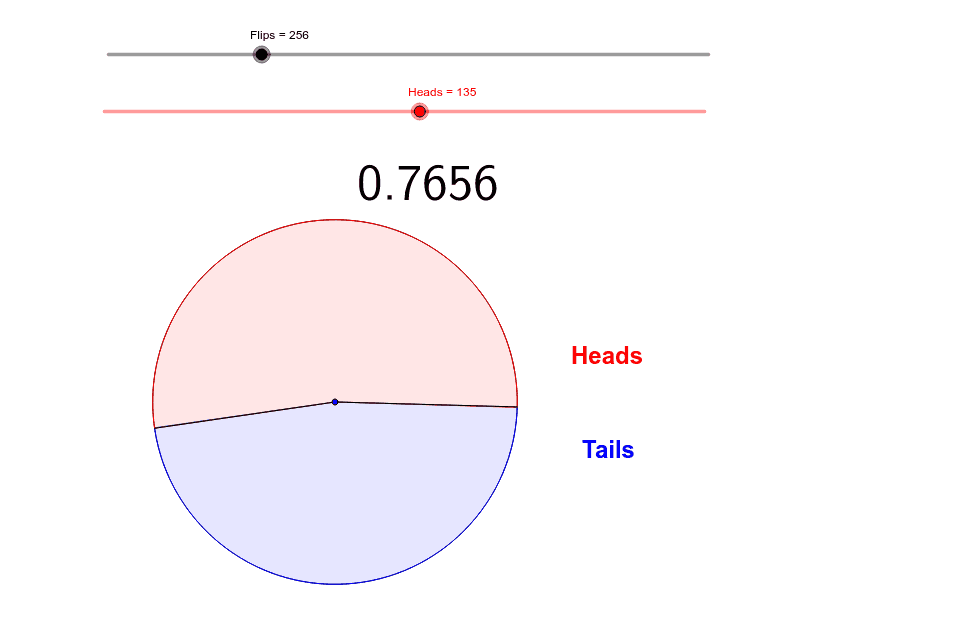
This example demonstrates the chi-squared goodness of fit test for a single coin flip. Key mathematical concepts include the chi-squared test in probability and statistics. Using the commands from the construction summary, one can understand how to use GeoGebra to plot the expected and actual distributions of coin flips and calculate the chi-squared value. Suitable for high school mathematics education and students learning probability and statistics.
GeoGebra Commands & Parameters
LaTeX(ChiSq) → text1ChiSquared(1, ChiSq) → aCircle(A, 20) → cPoint(c) → BRotate(B, angle°, A) → B'Angle(B, A, B') → αSegment(B', A) → bSegment(A, B) → dCircleSector(A, B', B) → eCircleSector(A, B, B') → f
AI Drawing Prompt Reference
Draw a chi-squared goodness of fit test for a coin flip. Start by drawing a circle, then take a point B on the circle and rotate it around point A to get point B'. Draw angle α, then draw line segments from B' to A and from A to B, and finally draw two sectors with central angles α and 360°-α respectively.
The prompt above was compiled from the original drawing commands and is for reference only.