
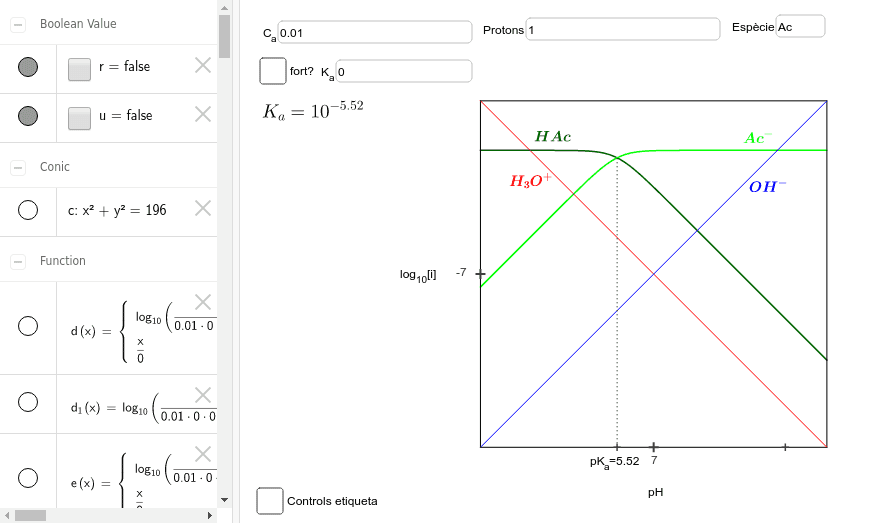
Chemical Logarithmic Diagram
Loading the math board and drawing, please wait…
In collections
Chemical Equations (In German by Reiner Hartl)
This example demonstrates a chemical logarithmic diagram, involving the concept of logarithmic functions. Using GeoGebra commands such as Intersect, Circle, and OrthogonalLine, the geometric representation of the logarithmic diagram is constructed. Suitable for high school mathematics education, particularly for coordinate geometry and function graphing.
GeoGebra Commands & Parameters
Intersect(xAxis, yAxis) → ACircle(A, 14) → cIntersect(c, xAxis, 2) → BIntersect(c, yAxis, 1) → COrthogonalLine(C, yAxis) → aOrthogonalLine(B, xAxis) → bIntersect(a, b) → DSegment(C, D) → d_2Segment(D, B) → e_2Segment(B, A) → f_2Segment(A, C) → g_2Segment(A, D) → h_2Segment(C, B) → iTextfield(C_a) → CampEntradaSortida1Textfield(k) → CampEntradaSortida2Textfield(p) → CampEntradaSortida6Midpoint(A, C) → EMidpoint(C, D) → FIntersect(m_1, n_1, (5.522878745280339, -2.3010299956639804)) → HSegment(G, H) → tPoint(h_2) → IPoint(i) → JPoint(n_1) → LPoint(l) → MTextfield(k_{11}) → CampEntradaSortida3Textfield(k_{21}) → CampEntradaSortida4Textfield(k_{31}) → CampEntradaSortida5Textfield(k_{12}) → CampEntradaSortida7Textfield(k_{22}) → CampEntradaSortida8Textfield(k_{32}) → CampEntradaSortida9Textfield(text11) → CampEntradaSortida10Point(f_1) → KPoint(g_1) → NIntersect(f, g, (7.209996129329107, -2.30102999568123)) → OSegment(P, O) → a_1Point(h) → QIntersect(g, h, (2.16, -2.3010319309864906)) → SSegment(S, R) → b_1Point(v) → TPoint(w) → UPoint(d) → VPoint(e) → WIntersect(v, w, (12.32, -2.3010316812599068)) → A_1Segment(Z, A_1) → c_1
AI Drawing Prompt Reference
Draw a chemical logarithmic diagram: start with a circle centered at the origin with radius 14, intersecting both axes. From the intersection points on the axes, draw perpendicular lines to the axes; these two lines meet at a point, forming a right triangle with the origin and the axis intercepts. Place multiple text input boxes inside and along the triangle for chemical parameters. Mark midpoints on the triangle sides and connect some of them with auxiliary segments. Below the triangle, draw several horizontal lines that intersect with slanted lines, creating multiple intersection points representing chemical equilibrium concentrations. The overall figure includes the circle, triangle, auxiliary lines, intersection points, and text labels, illustrating logarithmic relationships in chemistry.
The prompt above was compiled from the original drawing commands and is for reference only.