
Camel – A Playful Figure from Geometric Distribution and Trigonometric Functions
Loading the math board and drawing, please wait…
In collections
Fractured Fractions
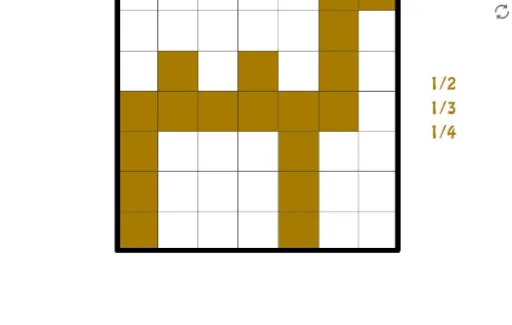
This GeoGebra example constructs a playful figure named 'Camel', demonstrating how to combine geometric distribution, arithmetic operations, and trigonometric functions to generate a camel-like outline or point set. The core mathematical concepts include geometric distribution (controlling the distribution or randomness of points), trigonometric functions (creating the humps and body curves), and arithmetic operations (for coordinate transformations and scaling). Construction highlights: from the summary, objects A, B, and image pic1 are used; likely points A and B serve as control points, while trigonometric expressions generate a series of points, possibly connected via locus or sequence commands to form the camel shape, with an image inserted as background or reference. This example suits middle school to university students, offering an engaging way to explore the intersection of mathematics and art, understand parametric equations, function graphs, and geometric transformations, and serves as an introductory case for mathematical modeling or creative coding.
GeoGebra Commands & Parameters
Point A(-4.184, -2.6800000000000015)Point B(5.881600000000001, -2.6800000000000015)
AI Drawing Prompt Reference
Draw a camel-like shape with points A at (-4.184, -2.68) and B at (5.882, -2.68) as control points. Use trigonometric functions to generate a series of points, then connect them with coordinate transformations and scaling to form the camel hump outline. Insert an image as background reference.
The prompt above was compiled from the original drawing commands and is for reference only.