
C1 Exercise 3E Q3a: Inequalities and Straight Lines Demo
Loading the math board and drawing, please wait…
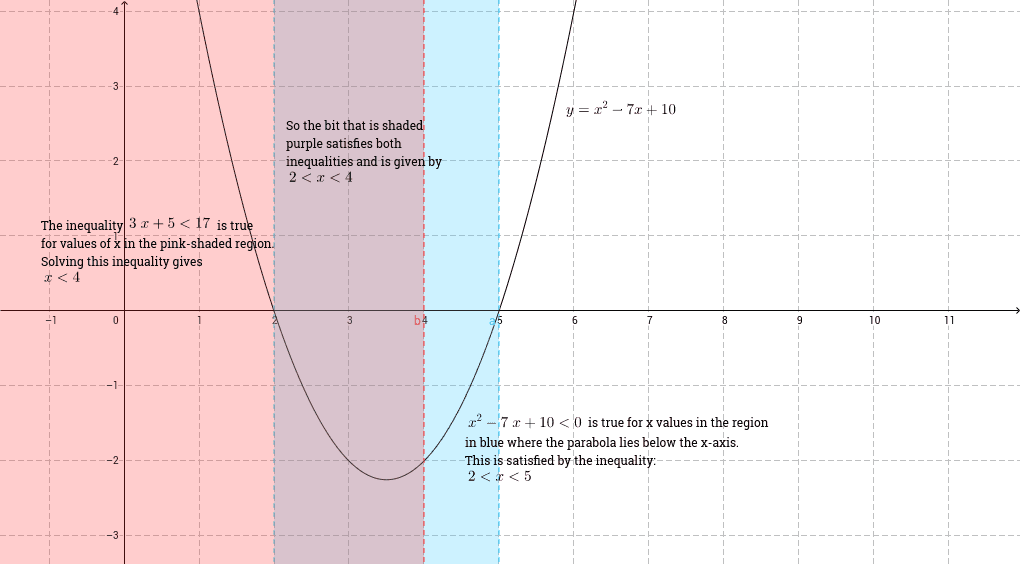
① This example shows how to plot a system of inequalities together with straight lines in GeoGebra and label the key intersection points. ② Core mathematical concepts include quadratic inequalities, linear equations, coordinate‑geometry intersection analysis, and function graph interpretation. ③ Construction highlights: Point commands create points a, b, c representing the boundary‑line intersections; Text commands produce text1‑text4 to annotate coordinates and inequality regions. ④ Suitable for high‑school compulsory mathematics (Inequalities chapter) classroom demonstration, self‑study review, and teacher preparation materials.
GeoGebra Commands & Parameters
a: x^(2) - 7 * x + 10 < 0Conic cb: 3 * x + 5 < 17
AI Drawing Prompt Reference
Please draw a coordinate-plane figure showing a system of inequalities and boundary objects: first shade the solution region of the quadratic inequality x^2 - 7x + 10 < 0, then include a conic boundary object, and shade the solution region of the linear inequality 3x + 5 < 17. Finally, mark the key boundary intersections and add text annotations for their coordinates and the inequality regions, suitable for a high-school inequalities demonstration.
The prompt above was compiled from the original drawing commands and is for reference only.