
Boxplot Demo
Loading the math board and drawing, please wait…
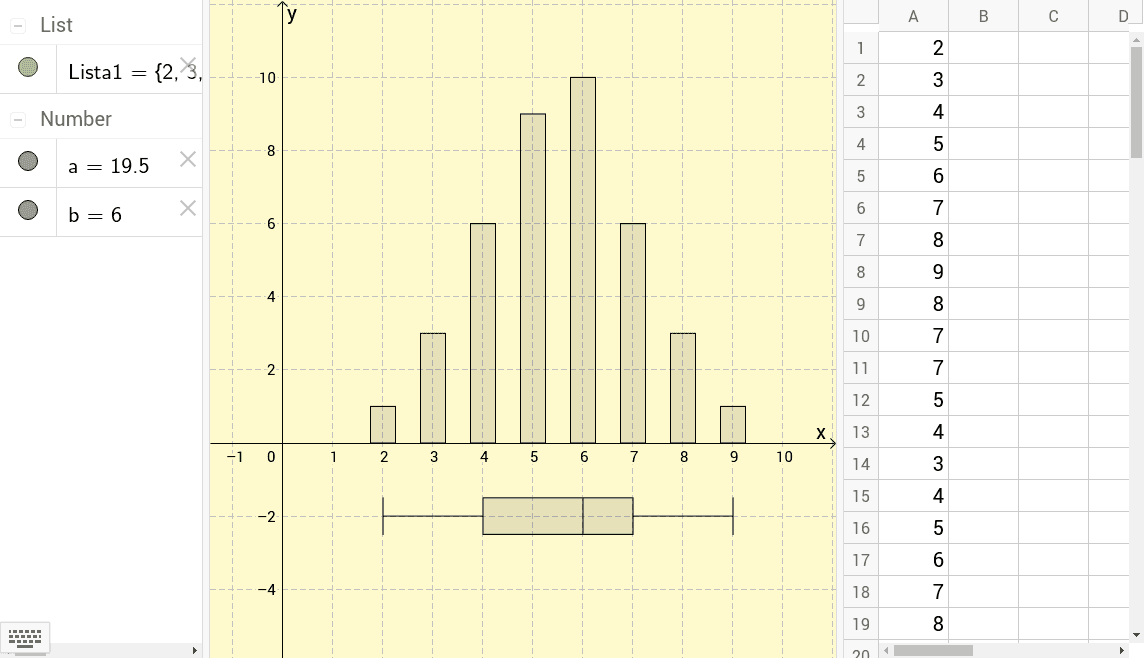
This example demonstrates the creation and visualization of a boxplot. It involves core mathematical concepts such as data distribution, median, quartiles, and range within probability and statistics. Constructed using GeoGebra commands like BarChart and BoxPlot, along with the data list object Lista1. Suitable for high school mathematics instruction in probability and statistics units for data visualization purposes.
GeoGebra Commands & Parameters
BarChart(Lista1, 0.5) → aBoxPlot(-2, 0.5, Lista1) → b