
Boxplot Construction Example by ulled01
Loading the math board and drawing, please wait…
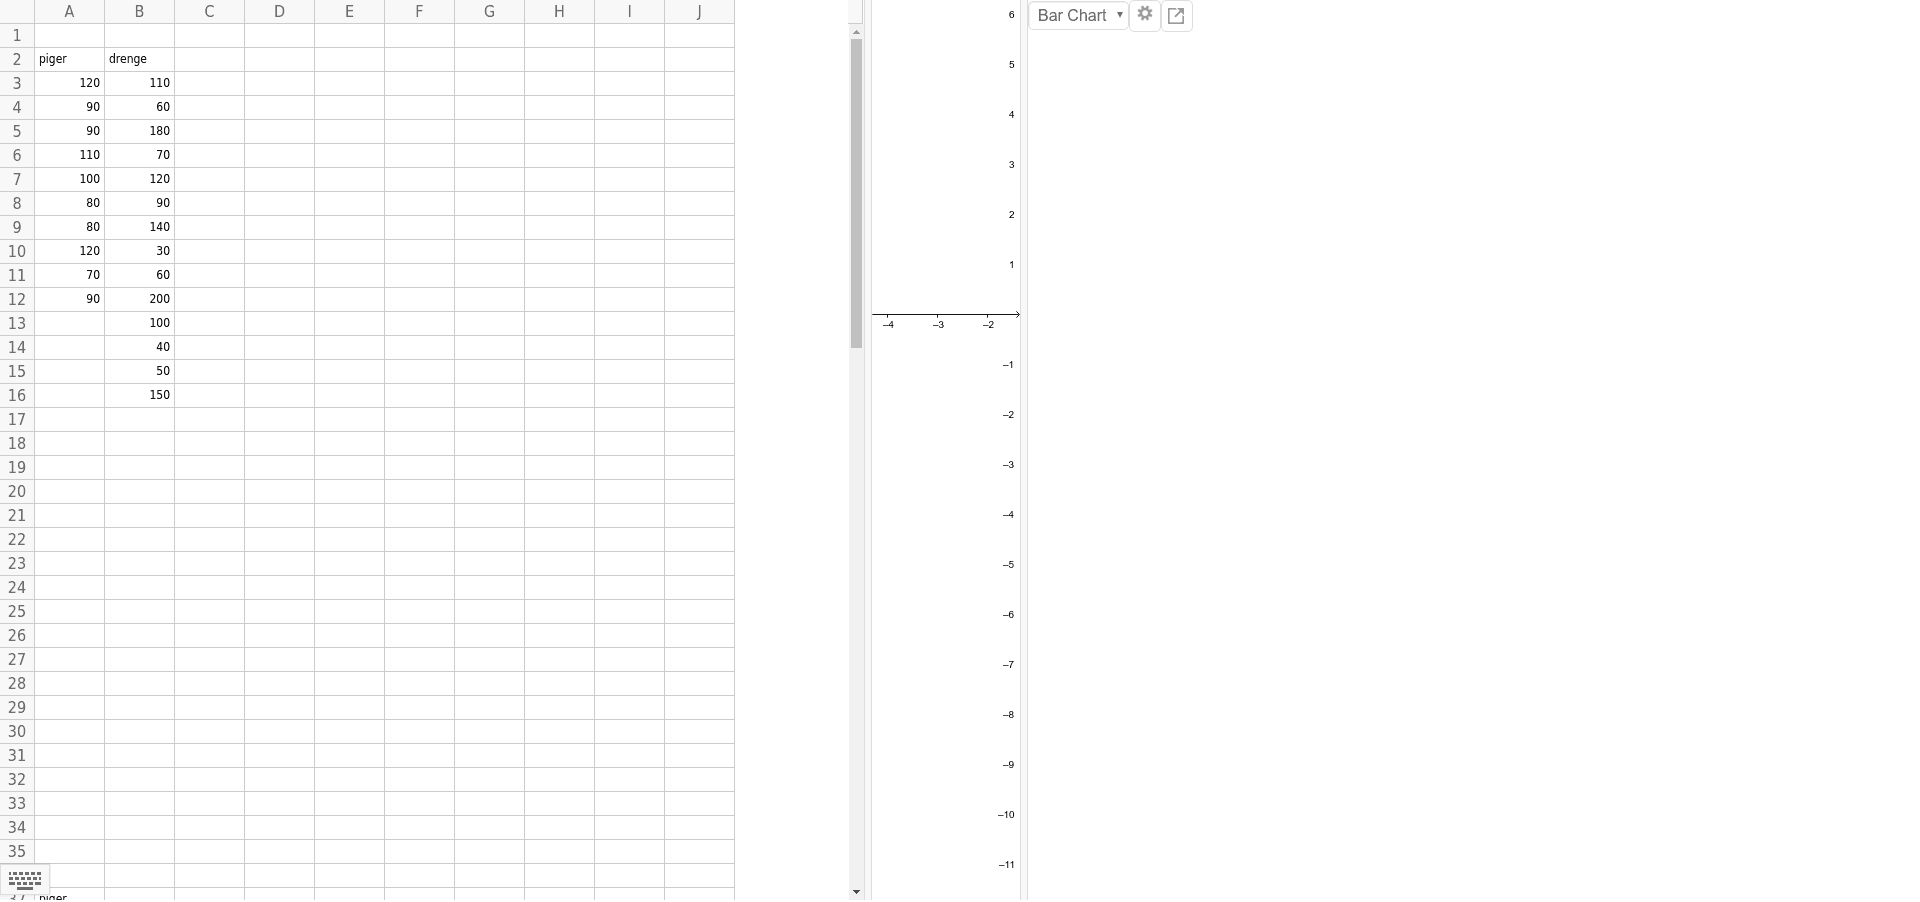
This example demonstrates how to create a boxplot using GeoGebra to visualize data distribution. Key math concepts include probability & statistics related to boxplots, median values, quartiles, etc. Construction involves using GeoGebra commands BoxPlot and Text with objects A37 to B16. Suitable for high school students and educators.
GeoGebra Commands & Parameters
BoxPlot(1, 0.3333333333333333, {110, 60, 180, 70, 120, 90, 140, 30, 60, 200, 100, 40, 50, 150}, true) →BoxPlot(2, 0.3333333333333333, {120, 90, 90, 110, 100, 80, 80, 120, 70, 90}, true) →Text(" B2:B16 ", (-12.5, 1)) →Text(" A2:A16 ", (-12.5, 2)) →Text(" B2:B16 ", (-12.5, 1)) →Text(" A2:A16 ", (-12.5, 2)) →
AI Drawing Prompt Reference
Create a boxplot chart with two vertically stacked box plots representing two datasets. The first dataset has 14 values, and the second has 10 values. Each box plot should be drawn with a moderate width, positioned at different heights. Add text labels on the left side of each box plot to indicate the corresponding data range or name. The overall design should be clean and educational, highlighting median, quartiles, and potential outliers.
The prompt above was compiled from the original drawing commands and is for reference only.