
Box plot samples of 20
Loading the math board and drawing, please wait…
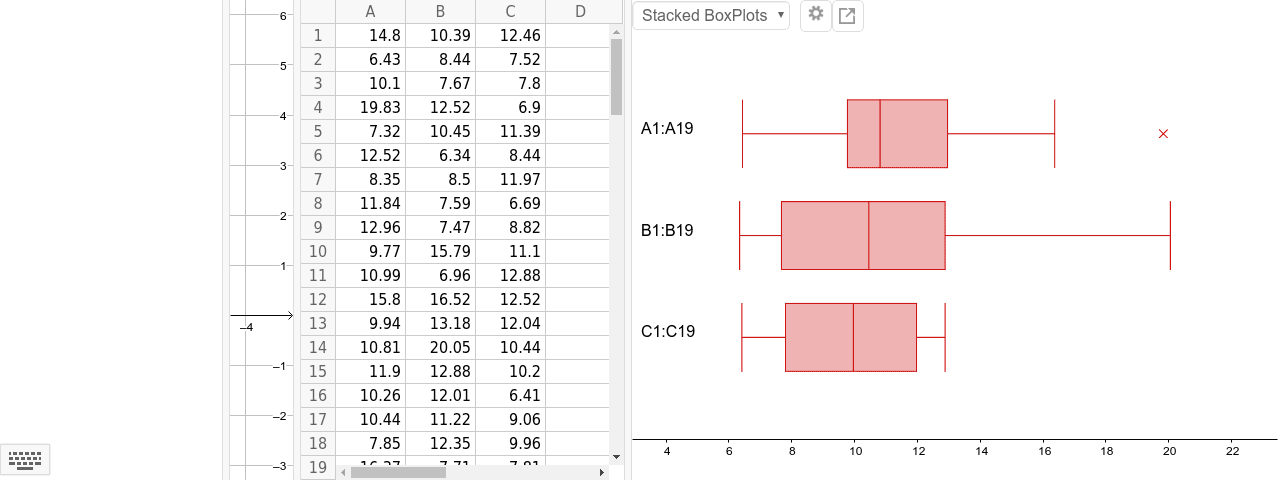
This example demonstrates how to create box plots for 20 samples using GeoGebra. It involves core mathematical concepts such as box plots, statistics, median value, functions, vectors, integral calculus, and orthocenter. The construction uses the BoxPlot and Text commands along with multiple data points (A1 to C19). Suitable for high school and above students learning data statistics and visualization.
GeoGebra Commands & Parameters
BoxPlot(1, 0.3333333333333333, {12.46, 7.52, 7.8, 6.9, 11.39, 8.44, 11.97, 6.69, 8.82, 11.1, 12.88, 12.52, 12.04, 10.44, 10.2, 6.41, 9.06, 9.96, 7.81}, true) →BoxPlot(2, 0.3333333333333333, {10.39, 8.44, 7.67, 12.52, 10.45, 6.34, 8.5, 7.59, 7.47, 15.79, 6.96, 16.52, 13.18, 20.05, 12.88, 12.01, 11.22, 12.35, 7.71}, true) →BoxPlot(3, 0.3333333333333333, {14.8, 6.43, 10.1, 19.83, 7.32, 12.52, 8.35, 11.84, 12.96, 9.77, 10.99, 15.8, 9.94, 10.81, 11.9, 10.26, 10.44, 7.85, 16.37}, true) →Text(" C1:C19 ", (2.9124999999999996, 1)) →Text(" B1:B19 ", (2.9124999999999996, 2)) →Text(" A1:A19 ", (2.9124999999999996, 3)) →Text(" C1:C19 ", (2.9124999999999996, 1)) →Text(" B1:B19 ", (2.9124999999999996, 2)) →Text(" A1:A19 ", (2.9124999999999996, 3)) →
AI Drawing Prompt Reference
Create three box plots, each containing 20 sample data points from three different groups, with each group represented in a distinct color. Label the groups below each box plot. Display the box plots with adequate spacing to differentiate between them, showcasing the distribution of statistical data.
The prompt above was compiled from the original drawing commands and is for reference only.